Immigrants from Senegal vs Welsh 4 or more Vehicles in Household
COMPARE
Immigrants from Senegal
Welsh
4 or more Vehicles in Household
4 or more Vehicles in Household Comparison
Immigrants from Senegal
Welsh
4.2%
4 OR MORE VEHICLES IN HOUSEHOLD
0.0/ 100
METRIC RATING
329th/ 347
METRIC RANK
7.5%
4 OR MORE VEHICLES IN HOUSEHOLD
99.9/ 100
METRIC RATING
68th/ 347
METRIC RANK
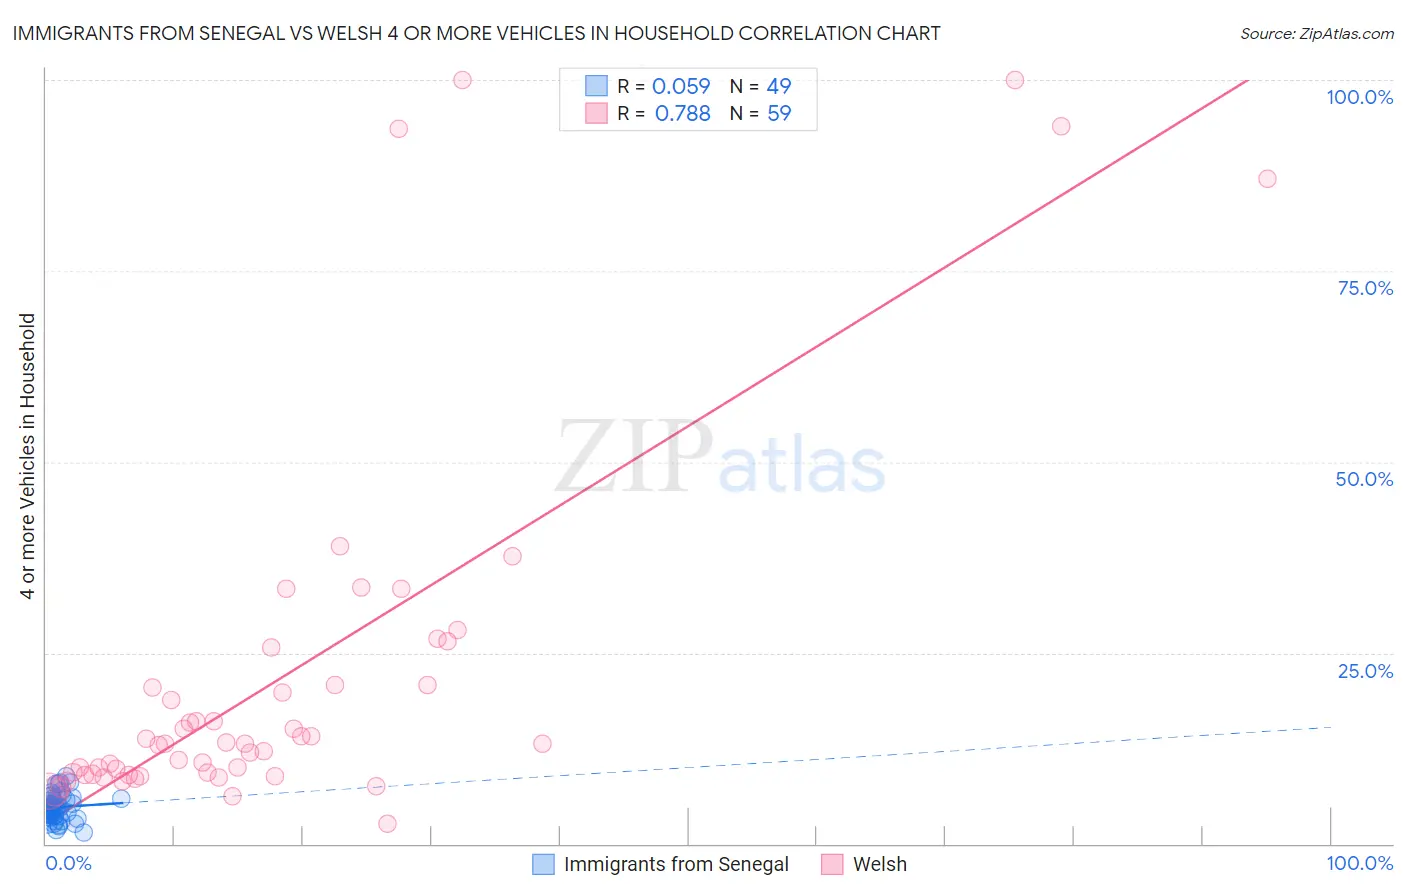
Immigrants from Senegal vs Welsh 4 or more Vehicles in Household Correlation Chart
The statistical analysis conducted on geographies consisting of 89,828,164 people shows a slight positive correlation between the proportion of Immigrants from Senegal and percentage of households with 4 or more vehicles available in the United States with a correlation coefficient (R) of 0.059 and weighted average of 4.2%. Similarly, the statistical analysis conducted on geographies consisting of 526,008,670 people shows a strong positive correlation between the proportion of Welsh and percentage of households with 4 or more vehicles available in the United States with a correlation coefficient (R) of 0.788 and weighted average of 7.5%, a difference of 76.7%.
4 or more Vehicles in Household Correlation Summary
| Measurement | Immigrants from Senegal | Welsh |
| Minimum | 1.5% | 2.6% |
| Maximum | 8.9% | 100.0% |
| Range | 7.5% | 97.4% |
| Mean | 4.8% | 21.8% |
| Median | 4.7% | 13.1% |
| Interquartile 25% (IQ1) | 3.6% | 9.1% |
| Interquartile 75% (IQ3) | 6.0% | 20.8% |
| Interquartile Range (IQR) | 2.3% | 11.8% |
| Standard Deviation (Sample) | 1.7% | 24.0% |
| Standard Deviation (Population) | 1.7% | 23.8% |
Similar Demographics by 4 or more Vehicles in Household
Demographics Similar to Immigrants from Senegal by 4 or more Vehicles in Household
In terms of 4 or more vehicles in household, the demographic groups most similar to Immigrants from Senegal are Immigrants from Ecuador (4.2%, a difference of 0.20%), Trinidadian and Tobagonian (4.3%, a difference of 0.27%), West Indian (4.2%, a difference of 0.46%), Immigrants from Dominica (4.2%, a difference of 1.4%), and Senegalese (4.3%, a difference of 1.9%).
| Demographics | Rating | Rank | 4 or more Vehicles in Household |
| Immigrants | Yemen | 0.0 /100 | #322 | Tragic 4.5% |
| Immigrants | Caribbean | 0.0 /100 | #323 | Tragic 4.4% |
| Soviet Union | 0.0 /100 | #324 | Tragic 4.4% |
| Immigrants | Jamaica | 0.0 /100 | #325 | Tragic 4.4% |
| Cape Verdeans | 0.0 /100 | #326 | Tragic 4.4% |
| Senegalese | 0.0 /100 | #327 | Tragic 4.3% |
| Trinidadians and Tobagonians | 0.0 /100 | #328 | Tragic 4.3% |
| Immigrants | Senegal | 0.0 /100 | #329 | Tragic 4.2% |
| Immigrants | Ecuador | 0.0 /100 | #330 | Tragic 4.2% |
| West Indians | 0.0 /100 | #331 | Tragic 4.2% |
| Immigrants | Dominica | 0.0 /100 | #332 | Tragic 4.2% |
| Immigrants | Albania | 0.0 /100 | #333 | Tragic 4.1% |
| Immigrants | Trinidad and Tobago | 0.0 /100 | #334 | Tragic 4.1% |
| Barbadians | 0.0 /100 | #335 | Tragic 3.9% |
| Immigrants | Bangladesh | 0.0 /100 | #336 | Tragic 3.9% |
Demographics Similar to Welsh by 4 or more Vehicles in Household
In terms of 4 or more vehicles in household, the demographic groups most similar to Welsh are American (7.5%, a difference of 0.36%), Immigrants from Taiwan (7.5%, a difference of 0.37%), German (7.5%, a difference of 0.59%), Scottish (7.4%, a difference of 0.67%), and Immigrants from the Azores (7.5%, a difference of 0.70%).
| Demographics | Rating | Rank | 4 or more Vehicles in Household |
| Europeans | 100.0 /100 | #61 | Exceptional 7.6% |
| Chippewa | 100.0 /100 | #62 | Exceptional 7.6% |
| Immigrants | Micronesia | 100.0 /100 | #63 | Exceptional 7.6% |
| Bangladeshis | 100.0 /100 | #64 | Exceptional 7.6% |
| Immigrants | Azores | 100.0 /100 | #65 | Exceptional 7.5% |
| Immigrants | Taiwan | 99.9 /100 | #66 | Exceptional 7.5% |
| Americans | 99.9 /100 | #67 | Exceptional 7.5% |
| Welsh | 99.9 /100 | #68 | Exceptional 7.5% |
| Germans | 99.9 /100 | #69 | Exceptional 7.5% |
| Scottish | 99.9 /100 | #70 | Exceptional 7.4% |
| Chickasaw | 99.9 /100 | #71 | Exceptional 7.4% |
| Scotch-Irish | 99.9 /100 | #72 | Exceptional 7.4% |
| Portuguese | 99.9 /100 | #73 | Exceptional 7.4% |
| Icelanders | 99.9 /100 | #74 | Exceptional 7.4% |
| Immigrants | Cambodia | 99.9 /100 | #75 | Exceptional 7.4% |