Immigrants from Senegal vs Immigrants from Syria In Labor Force | Age > 16
COMPARE
Immigrants from Senegal
Immigrants from Syria
In Labor Force | Age > 16
In Labor Force | Age > 16 Comparison
Immigrants from Senegal
Immigrants from Syria
66.4%
IN LABOR FORCE | AGE > 16
99.9/ 100
METRIC RATING
56th/ 347
METRIC RANK
65.3%
IN LABOR FORCE | AGE > 16
74.6/ 100
METRIC RATING
159th/ 347
METRIC RANK
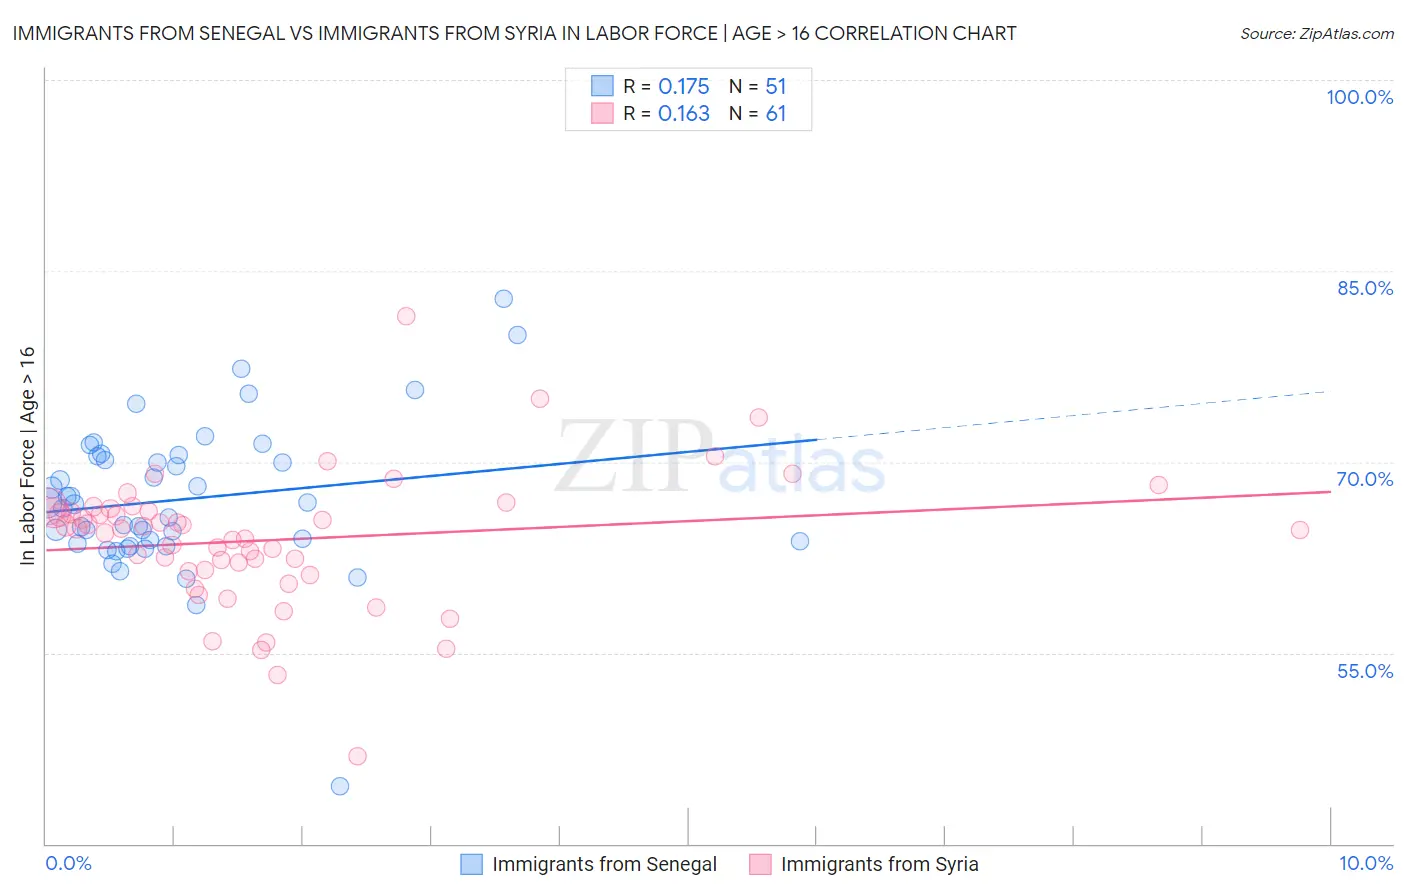
Immigrants from Senegal vs Immigrants from Syria In Labor Force | Age > 16 Correlation Chart
The statistical analysis conducted on geographies consisting of 90,129,295 people shows a poor positive correlation between the proportion of Immigrants from Senegal and labor force participation rate among population ages 16 and over in the United States with a correlation coefficient (R) of 0.175 and weighted average of 66.4%. Similarly, the statistical analysis conducted on geographies consisting of 174,113,634 people shows a poor positive correlation between the proportion of Immigrants from Syria and labor force participation rate among population ages 16 and over in the United States with a correlation coefficient (R) of 0.163 and weighted average of 65.3%, a difference of 1.7%.
In Labor Force | Age > 16 Correlation Summary
| Measurement | Immigrants from Senegal | Immigrants from Syria |
| Minimum | 44.5% | 46.9% |
| Maximum | 82.8% | 81.4% |
| Range | 38.3% | 34.5% |
| Mean | 67.1% | 63.9% |
| Median | 66.7% | 64.7% |
| Interquartile 25% (IQ1) | 63.6% | 61.5% |
| Interquartile 75% (IQ3) | 70.4% | 66.2% |
| Interquartile Range (IQR) | 6.9% | 4.7% |
| Standard Deviation (Sample) | 5.9% | 5.3% |
| Standard Deviation (Population) | 5.9% | 5.2% |
Similar Demographics by In Labor Force | Age > 16
Demographics Similar to Immigrants from Senegal by In Labor Force | Age > 16
In terms of in labor force | age > 16, the demographic groups most similar to Immigrants from Senegal are Bulgarian (66.4%, a difference of 0.010%), Immigrants from Venezuela (66.4%, a difference of 0.030%), Immigrants from Bosnia and Herzegovina (66.5%, a difference of 0.080%), Immigrants from Sri Lanka (66.5%, a difference of 0.11%), and Immigrants from Saudi Arabia (66.3%, a difference of 0.11%).
| Demographics | Rating | Rank | In Labor Force | Age > 16 |
| Immigrants | Northern Africa | 100.0 /100 | #49 | Exceptional 66.6% |
| Cape Verdeans | 100.0 /100 | #50 | Exceptional 66.6% |
| Immigrants | Kuwait | 100.0 /100 | #51 | Exceptional 66.5% |
| Paraguayans | 99.9 /100 | #52 | Exceptional 66.5% |
| Immigrants | Sri Lanka | 99.9 /100 | #53 | Exceptional 66.5% |
| Immigrants | Bosnia and Herzegovina | 99.9 /100 | #54 | Exceptional 66.5% |
| Immigrants | Venezuela | 99.9 /100 | #55 | Exceptional 66.4% |
| Immigrants | Senegal | 99.9 /100 | #56 | Exceptional 66.4% |
| Bulgarians | 99.9 /100 | #57 | Exceptional 66.4% |
| Immigrants | Saudi Arabia | 99.9 /100 | #58 | Exceptional 66.3% |
| Immigrants | Turkey | 99.9 /100 | #59 | Exceptional 66.3% |
| Immigrants | Peru | 99.8 /100 | #60 | Exceptional 66.3% |
| Immigrants | Burma/Myanmar | 99.8 /100 | #61 | Exceptional 66.3% |
| Indonesians | 99.8 /100 | #62 | Exceptional 66.3% |
| Venezuelans | 99.8 /100 | #63 | Exceptional 66.3% |
Demographics Similar to Immigrants from Syria by In Labor Force | Age > 16
In terms of in labor force | age > 16, the demographic groups most similar to Immigrants from Syria are Panamanian (65.3%, a difference of 0.010%), Immigrants from Ireland (65.3%, a difference of 0.020%), Immigrants from Russia (65.3%, a difference of 0.020%), Immigrants from South Africa (65.3%, a difference of 0.020%), and Immigrants from Armenia (65.3%, a difference of 0.030%).
| Demographics | Rating | Rank | In Labor Force | Age > 16 |
| Yugoslavians | 81.3 /100 | #152 | Excellent 65.4% |
| Immigrants | China | 80.5 /100 | #153 | Excellent 65.4% |
| Immigrants | Eastern Europe | 78.3 /100 | #154 | Good 65.4% |
| Immigrants | Armenia | 76.6 /100 | #155 | Good 65.3% |
| Immigrants | Ireland | 75.9 /100 | #156 | Good 65.3% |
| Immigrants | Russia | 75.7 /100 | #157 | Good 65.3% |
| Panamanians | 75.2 /100 | #158 | Good 65.3% |
| Immigrants | Syria | 74.6 /100 | #159 | Good 65.3% |
| Immigrants | South Africa | 73.5 /100 | #160 | Good 65.3% |
| Australians | 71.3 /100 | #161 | Good 65.3% |
| Albanians | 70.8 /100 | #162 | Good 65.3% |
| South Africans | 69.8 /100 | #163 | Good 65.3% |
| Danes | 68.8 /100 | #164 | Good 65.3% |
| Immigrants | Kazakhstan | 68.1 /100 | #165 | Good 65.3% |
| Immigrants | Western Asia | 67.3 /100 | #166 | Good 65.3% |