German Russian vs Immigrants from Syria 4 or more Vehicles in Household
COMPARE
German Russian
Immigrants from Syria
4 or more Vehicles in Household
4 or more Vehicles in Household Comparison
German Russians
Immigrants from Syria
7.0%
4 OR MORE VEHICLES IN HOUSEHOLD
98.3/ 100
METRIC RATING
105th/ 347
METRIC RANK
6.3%
4 OR MORE VEHICLES IN HOUSEHOLD
52.8/ 100
METRIC RATING
170th/ 347
METRIC RANK
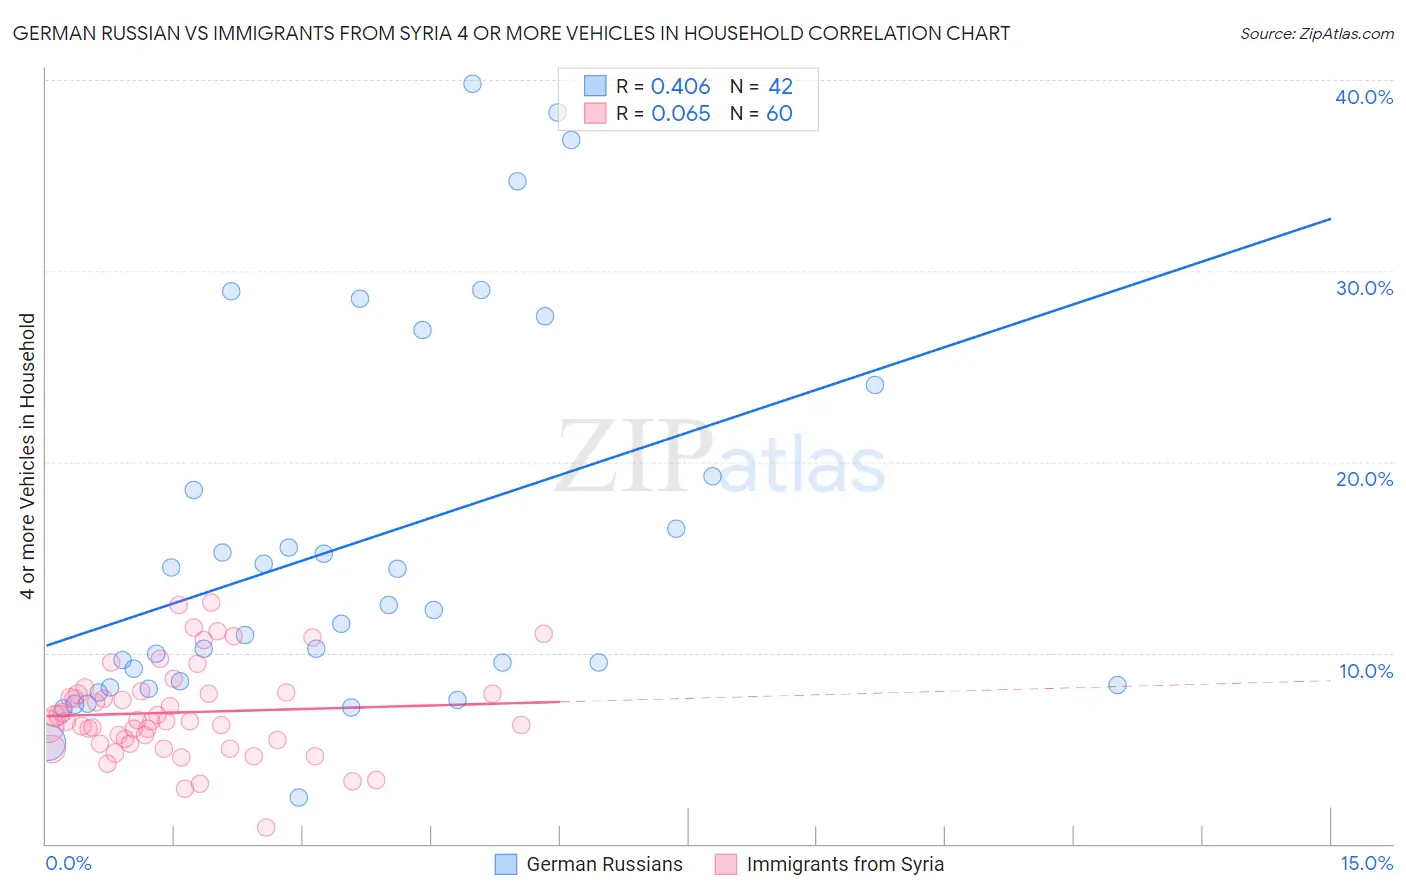
German Russian vs Immigrants from Syria 4 or more Vehicles in Household Correlation Chart
The statistical analysis conducted on geographies consisting of 96,366,616 people shows a moderate positive correlation between the proportion of German Russians and percentage of households with 4 or more vehicles available in the United States with a correlation coefficient (R) of 0.406 and weighted average of 7.0%. Similarly, the statistical analysis conducted on geographies consisting of 173,706,064 people shows a slight positive correlation between the proportion of Immigrants from Syria and percentage of households with 4 or more vehicles available in the United States with a correlation coefficient (R) of 0.065 and weighted average of 6.3%, a difference of 10.0%.
4 or more Vehicles in Household Correlation Summary
| Measurement | German Russian | Immigrants from Syria |
| Minimum | 2.4% | 0.83% |
| Maximum | 39.8% | 12.6% |
| Range | 37.3% | 11.8% |
| Mean | 15.7% | 6.9% |
| Median | 11.9% | 6.4% |
| Interquartile 25% (IQ1) | 8.3% | 5.3% |
| Interquartile 75% (IQ3) | 19.2% | 7.9% |
| Interquartile Range (IQR) | 10.9% | 2.6% |
| Standard Deviation (Sample) | 9.9% | 2.4% |
| Standard Deviation (Population) | 9.8% | 2.4% |
Similar Demographics by 4 or more Vehicles in Household
Demographics Similar to German Russians by 4 or more Vehicles in Household
In terms of 4 or more vehicles in household, the demographic groups most similar to German Russians are Hmong (7.0%, a difference of 0.0%), Guatemalan (7.0%, a difference of 0.34%), Nicaraguan (7.0%, a difference of 0.36%), Blackfeet (7.0%, a difference of 0.48%), and Asian (7.0%, a difference of 0.49%).
| Demographics | Rating | Rank | 4 or more Vehicles in Household |
| Irish | 99.0 /100 | #98 | Exceptional 7.1% |
| Seminole | 98.8 /100 | #99 | Exceptional 7.0% |
| Taiwanese | 98.7 /100 | #100 | Exceptional 7.0% |
| Pakistanis | 98.7 /100 | #101 | Exceptional 7.0% |
| Asians | 98.6 /100 | #102 | Exceptional 7.0% |
| Blackfeet | 98.6 /100 | #103 | Exceptional 7.0% |
| Hmong | 98.3 /100 | #104 | Exceptional 7.0% |
| German Russians | 98.3 /100 | #105 | Exceptional 7.0% |
| Guatemalans | 98.1 /100 | #106 | Exceptional 7.0% |
| Nicaraguans | 98.0 /100 | #107 | Exceptional 7.0% |
| French | 97.7 /100 | #108 | Exceptional 6.9% |
| Filipinos | 97.6 /100 | #109 | Exceptional 6.9% |
| Immigrants | Thailand | 97.0 /100 | #110 | Exceptional 6.9% |
| Aleuts | 97.0 /100 | #111 | Exceptional 6.9% |
| Hopi | 97.0 /100 | #112 | Exceptional 6.9% |
Demographics Similar to Immigrants from Syria by 4 or more Vehicles in Household
In terms of 4 or more vehicles in household, the demographic groups most similar to Immigrants from Syria are Immigrants from India (6.3%, a difference of 0.080%), Immigrants from Lebanon (6.3%, a difference of 0.11%), Slovene (6.3%, a difference of 0.16%), Estonian (6.4%, a difference of 0.24%), and Lithuanian (6.3%, a difference of 0.28%).
| Demographics | Rating | Rank | 4 or more Vehicles in Household |
| Chileans | 61.2 /100 | #163 | Good 6.4% |
| Hungarians | 61.1 /100 | #164 | Good 6.4% |
| Immigrants | Peru | 59.8 /100 | #165 | Average 6.4% |
| Immigrants | Denmark | 57.8 /100 | #166 | Average 6.4% |
| Poles | 56.9 /100 | #167 | Average 6.4% |
| Lebanese | 55.8 /100 | #168 | Average 6.4% |
| Estonians | 55.1 /100 | #169 | Average 6.4% |
| Immigrants | Syria | 52.8 /100 | #170 | Average 6.3% |
| Immigrants | India | 51.9 /100 | #171 | Average 6.3% |
| Immigrants | Lebanon | 51.7 /100 | #172 | Average 6.3% |
| Slovenes | 51.1 /100 | #173 | Average 6.3% |
| Lithuanians | 50.0 /100 | #174 | Average 6.3% |
| Immigrants | Western Europe | 48.8 /100 | #175 | Average 6.3% |
| Ukrainians | 47.6 /100 | #176 | Average 6.3% |
| Slovaks | 46.9 /100 | #177 | Average 6.3% |