Serbian vs Immigrants from Syria 4 or more Vehicles in Household
COMPARE
Serbian
Immigrants from Syria
4 or more Vehicles in Household
4 or more Vehicles in Household Comparison
Serbians
Immigrants from Syria
6.0%
4 OR MORE VEHICLES IN HOUSEHOLD
11.0/ 100
METRIC RATING
219th/ 347
METRIC RANK
6.3%
4 OR MORE VEHICLES IN HOUSEHOLD
52.8/ 100
METRIC RATING
170th/ 347
METRIC RANK
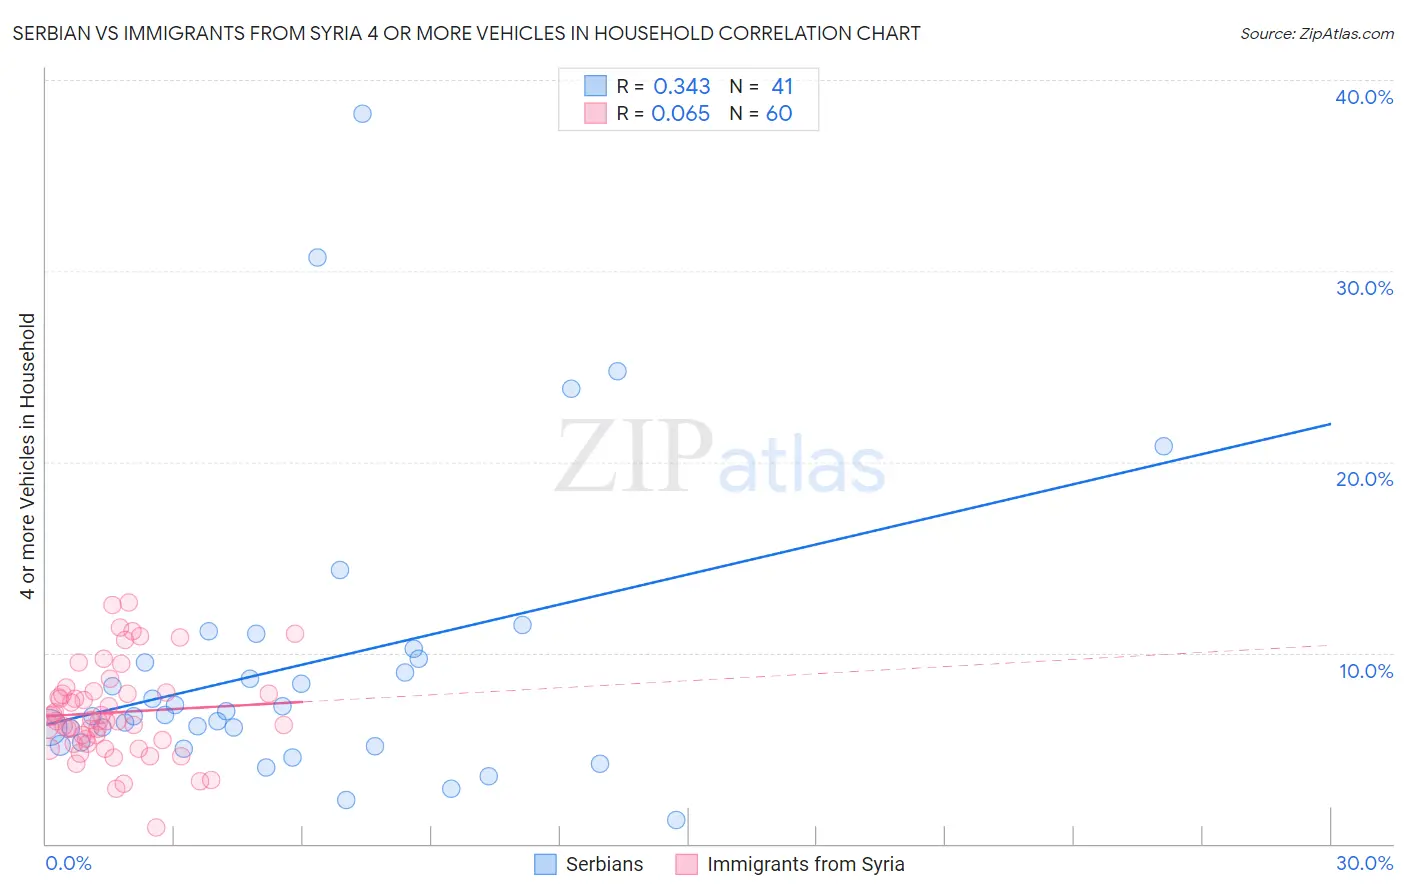
Serbian vs Immigrants from Syria 4 or more Vehicles in Household Correlation Chart
The statistical analysis conducted on geographies consisting of 266,656,513 people shows a mild positive correlation between the proportion of Serbians and percentage of households with 4 or more vehicles available in the United States with a correlation coefficient (R) of 0.343 and weighted average of 6.0%. Similarly, the statistical analysis conducted on geographies consisting of 173,706,064 people shows a slight positive correlation between the proportion of Immigrants from Syria and percentage of households with 4 or more vehicles available in the United States with a correlation coefficient (R) of 0.065 and weighted average of 6.3%, a difference of 5.9%.
4 or more Vehicles in Household Correlation Summary
| Measurement | Serbian | Immigrants from Syria |
| Minimum | 1.2% | 0.83% |
| Maximum | 38.2% | 12.6% |
| Range | 37.0% | 11.8% |
| Mean | 9.4% | 6.9% |
| Median | 6.7% | 6.4% |
| Interquartile 25% (IQ1) | 5.2% | 5.3% |
| Interquartile 75% (IQ3) | 10.0% | 7.9% |
| Interquartile Range (IQR) | 4.7% | 2.6% |
| Standard Deviation (Sample) | 7.7% | 2.4% |
| Standard Deviation (Population) | 7.6% | 2.4% |
Similar Demographics by 4 or more Vehicles in Household
Demographics Similar to Serbians by 4 or more Vehicles in Household
In terms of 4 or more vehicles in household, the demographic groups most similar to Serbians are Immigrants from Italy (6.0%, a difference of 0.0%), Russian (6.0%, a difference of 0.19%), Nigerian (6.0%, a difference of 0.31%), Immigrants from Moldova (6.0%, a difference of 0.49%), and Cajun (6.0%, a difference of 0.52%).
| Demographics | Rating | Rank | 4 or more Vehicles in Household |
| Immigrants | Egypt | 14.7 /100 | #212 | Poor 6.0% |
| Arabs | 14.4 /100 | #213 | Poor 6.0% |
| Immigrants | Austria | 14.3 /100 | #214 | Poor 6.0% |
| Immigrants | China | 13.8 /100 | #215 | Poor 6.0% |
| Immigrants | Romania | 13.8 /100 | #216 | Poor 6.0% |
| Nigerians | 12.2 /100 | #217 | Poor 6.0% |
| Immigrants | Italy | 11.0 /100 | #218 | Poor 6.0% |
| Serbians | 11.0 /100 | #219 | Poor 6.0% |
| Russians | 10.3 /100 | #220 | Poor 6.0% |
| Immigrants | Moldova | 9.3 /100 | #221 | Tragic 6.0% |
| Cajuns | 9.2 /100 | #222 | Tragic 6.0% |
| Immigrants | Kenya | 9.2 /100 | #223 | Tragic 6.0% |
| Cubans | 9.2 /100 | #224 | Tragic 6.0% |
| Indonesians | 8.9 /100 | #225 | Tragic 6.0% |
| Immigrants | Singapore | 7.9 /100 | #226 | Tragic 5.9% |
Demographics Similar to Immigrants from Syria by 4 or more Vehicles in Household
In terms of 4 or more vehicles in household, the demographic groups most similar to Immigrants from Syria are Immigrants from India (6.3%, a difference of 0.080%), Immigrants from Lebanon (6.3%, a difference of 0.11%), Slovene (6.3%, a difference of 0.16%), Estonian (6.4%, a difference of 0.24%), and Lithuanian (6.3%, a difference of 0.28%).
| Demographics | Rating | Rank | 4 or more Vehicles in Household |
| Chileans | 61.2 /100 | #163 | Good 6.4% |
| Hungarians | 61.1 /100 | #164 | Good 6.4% |
| Immigrants | Peru | 59.8 /100 | #165 | Average 6.4% |
| Immigrants | Denmark | 57.8 /100 | #166 | Average 6.4% |
| Poles | 56.9 /100 | #167 | Average 6.4% |
| Lebanese | 55.8 /100 | #168 | Average 6.4% |
| Estonians | 55.1 /100 | #169 | Average 6.4% |
| Immigrants | Syria | 52.8 /100 | #170 | Average 6.3% |
| Immigrants | India | 51.9 /100 | #171 | Average 6.3% |
| Immigrants | Lebanon | 51.7 /100 | #172 | Average 6.3% |
| Slovenes | 51.1 /100 | #173 | Average 6.3% |
| Lithuanians | 50.0 /100 | #174 | Average 6.3% |
| Immigrants | Western Europe | 48.8 /100 | #175 | Average 6.3% |
| Ukrainians | 47.6 /100 | #176 | Average 6.3% |
| Slovaks | 46.9 /100 | #177 | Average 6.3% |