Immigrants from Russia vs Immigrants from Sierra Leone 4 or more Vehicles in Household
COMPARE
Immigrants from Russia
Immigrants from Sierra Leone
4 or more Vehicles in Household
4 or more Vehicles in Household Comparison
Immigrants from Russia
Immigrants from Sierra Leone
5.3%
4 OR MORE VEHICLES IN HOUSEHOLD
0.2/ 100
METRIC RATING
290th/ 347
METRIC RANK
6.1%
4 OR MORE VEHICLES IN HOUSEHOLD
20.5/ 100
METRIC RATING
203rd/ 347
METRIC RANK
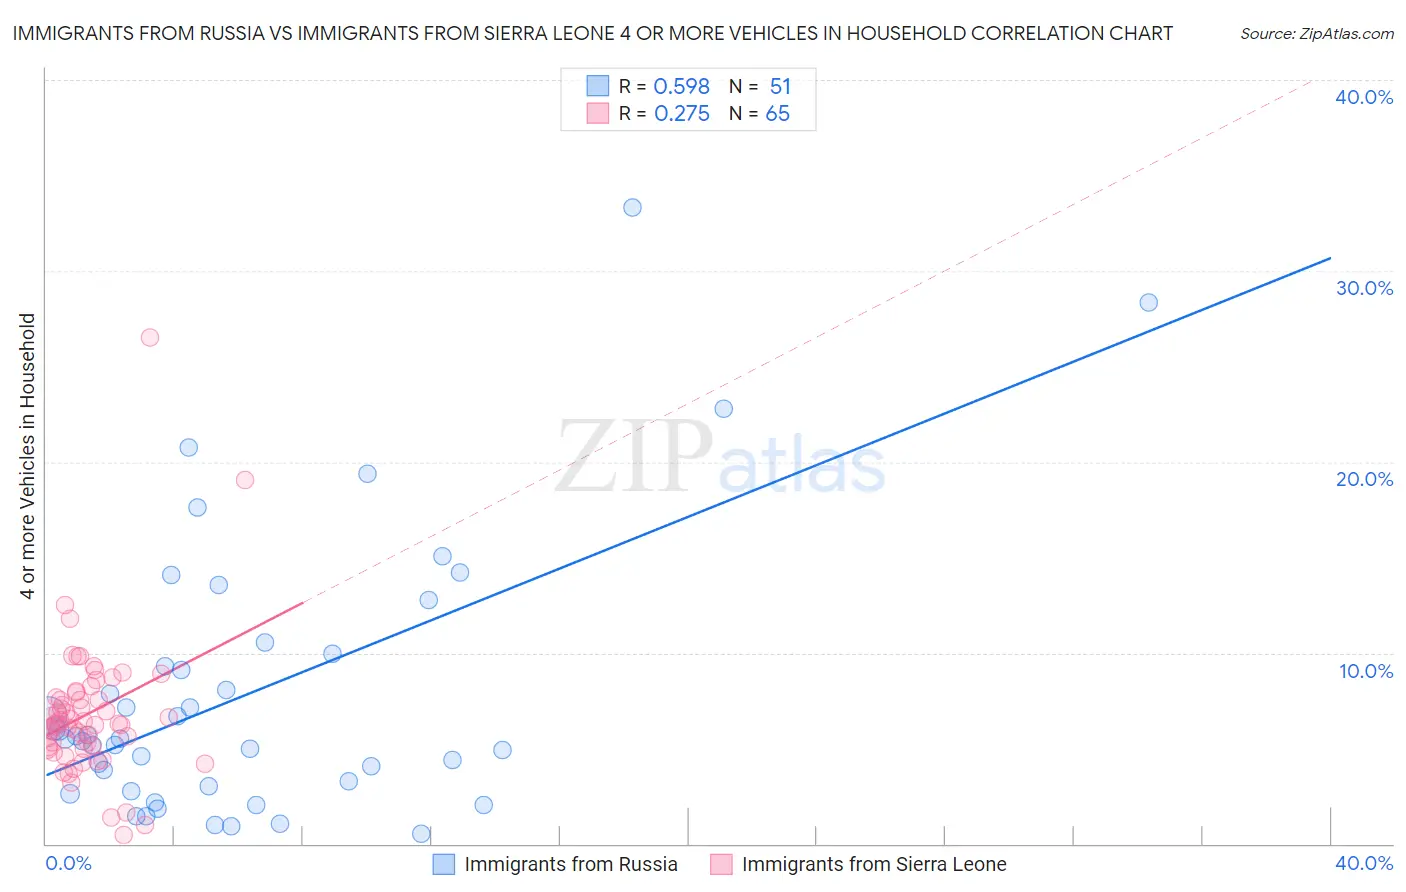
Immigrants from Russia vs Immigrants from Sierra Leone 4 or more Vehicles in Household Correlation Chart
The statistical analysis conducted on geographies consisting of 346,141,133 people shows a substantial positive correlation between the proportion of Immigrants from Russia and percentage of households with 4 or more vehicles available in the United States with a correlation coefficient (R) of 0.598 and weighted average of 5.3%. Similarly, the statistical analysis conducted on geographies consisting of 101,342,659 people shows a weak positive correlation between the proportion of Immigrants from Sierra Leone and percentage of households with 4 or more vehicles available in the United States with a correlation coefficient (R) of 0.275 and weighted average of 6.1%, a difference of 14.9%.
4 or more Vehicles in Household Correlation Summary
| Measurement | Immigrants from Russia | Immigrants from Sierra Leone |
| Minimum | 0.50% | 0.48% |
| Maximum | 33.3% | 26.5% |
| Range | 32.8% | 26.0% |
| Mean | 7.9% | 6.8% |
| Median | 5.5% | 6.3% |
| Interquartile 25% (IQ1) | 3.0% | 5.0% |
| Interquartile 75% (IQ3) | 9.9% | 7.8% |
| Interquartile Range (IQR) | 6.9% | 2.7% |
| Standard Deviation (Sample) | 7.1% | 3.7% |
| Standard Deviation (Population) | 7.1% | 3.7% |
Similar Demographics by 4 or more Vehicles in Household
Demographics Similar to Immigrants from Russia by 4 or more Vehicles in Household
In terms of 4 or more vehicles in household, the demographic groups most similar to Immigrants from Russia are Immigrants from Bosnia and Herzegovina (5.3%, a difference of 0.30%), Venezuelan (5.3%, a difference of 0.44%), Immigrants from Croatia (5.4%, a difference of 0.63%), Immigrants from Colombia (5.4%, a difference of 0.72%), and Immigrants from Liberia (5.4%, a difference of 0.76%).
| Demographics | Rating | Rank | 4 or more Vehicles in Household |
| Immigrants | Ireland | 0.3 /100 | #283 | Tragic 5.4% |
| Brazilians | 0.3 /100 | #284 | Tragic 5.4% |
| Immigrants | Liberia | 0.2 /100 | #285 | Tragic 5.4% |
| Immigrants | Colombia | 0.2 /100 | #286 | Tragic 5.4% |
| Immigrants | Croatia | 0.2 /100 | #287 | Tragic 5.4% |
| Venezuelans | 0.2 /100 | #288 | Tragic 5.3% |
| Immigrants | Bosnia and Herzegovina | 0.2 /100 | #289 | Tragic 5.3% |
| Immigrants | Russia | 0.2 /100 | #290 | Tragic 5.3% |
| Immigrants | Bahamas | 0.1 /100 | #291 | Tragic 5.3% |
| Liberians | 0.1 /100 | #292 | Tragic 5.3% |
| Immigrants | Congo | 0.1 /100 | #293 | Tragic 5.2% |
| Ghanaians | 0.1 /100 | #294 | Tragic 5.2% |
| Immigrants | Brazil | 0.1 /100 | #295 | Tragic 5.2% |
| Israelis | 0.1 /100 | #296 | Tragic 5.2% |
| Immigrants | Venezuela | 0.1 /100 | #297 | Tragic 5.2% |
Demographics Similar to Immigrants from Sierra Leone by 4 or more Vehicles in Household
In terms of 4 or more vehicles in household, the demographic groups most similar to Immigrants from Sierra Leone are Immigrants from Belize (6.1%, a difference of 0.10%), Immigrants from South Central Asia (6.1%, a difference of 0.14%), Egyptian (6.1%, a difference of 0.15%), Honduran (6.1%, a difference of 0.19%), and Immigrants from Norway (6.1%, a difference of 0.20%).
| Demographics | Rating | Rank | 4 or more Vehicles in Household |
| Tsimshian | 26.4 /100 | #196 | Fair 6.2% |
| Immigrants | Sri Lanka | 23.7 /100 | #197 | Fair 6.1% |
| Immigrants | Portugal | 22.3 /100 | #198 | Fair 6.1% |
| Immigrants | Norway | 21.8 /100 | #199 | Fair 6.1% |
| Latvians | 21.7 /100 | #200 | Fair 6.1% |
| Egyptians | 21.4 /100 | #201 | Fair 6.1% |
| Immigrants | South Central Asia | 21.3 /100 | #202 | Fair 6.1% |
| Immigrants | Sierra Leone | 20.5 /100 | #203 | Fair 6.1% |
| Immigrants | Belize | 19.8 /100 | #204 | Poor 6.1% |
| Hondurans | 19.3 /100 | #205 | Poor 6.1% |
| Kenyans | 18.5 /100 | #206 | Poor 6.1% |
| Immigrants | Chile | 16.9 /100 | #207 | Poor 6.1% |
| Immigrants | Nigeria | 15.6 /100 | #208 | Poor 6.1% |
| Immigrants | Honduras | 15.4 /100 | #209 | Poor 6.1% |
| Immigrants | Zimbabwe | 15.1 /100 | #210 | Poor 6.0% |