Immigrants from Russia vs Immigrants from El Salvador 4 or more Vehicles in Household
COMPARE
Immigrants from Russia
Immigrants from El Salvador
4 or more Vehicles in Household
4 or more Vehicles in Household Comparison
Immigrants from Russia
Immigrants from El Salvador
5.3%
4 OR MORE VEHICLES IN HOUSEHOLD
0.2/ 100
METRIC RATING
290th/ 347
METRIC RANK
7.7%
4 OR MORE VEHICLES IN HOUSEHOLD
100.0/ 100
METRIC RATING
50th/ 347
METRIC RANK
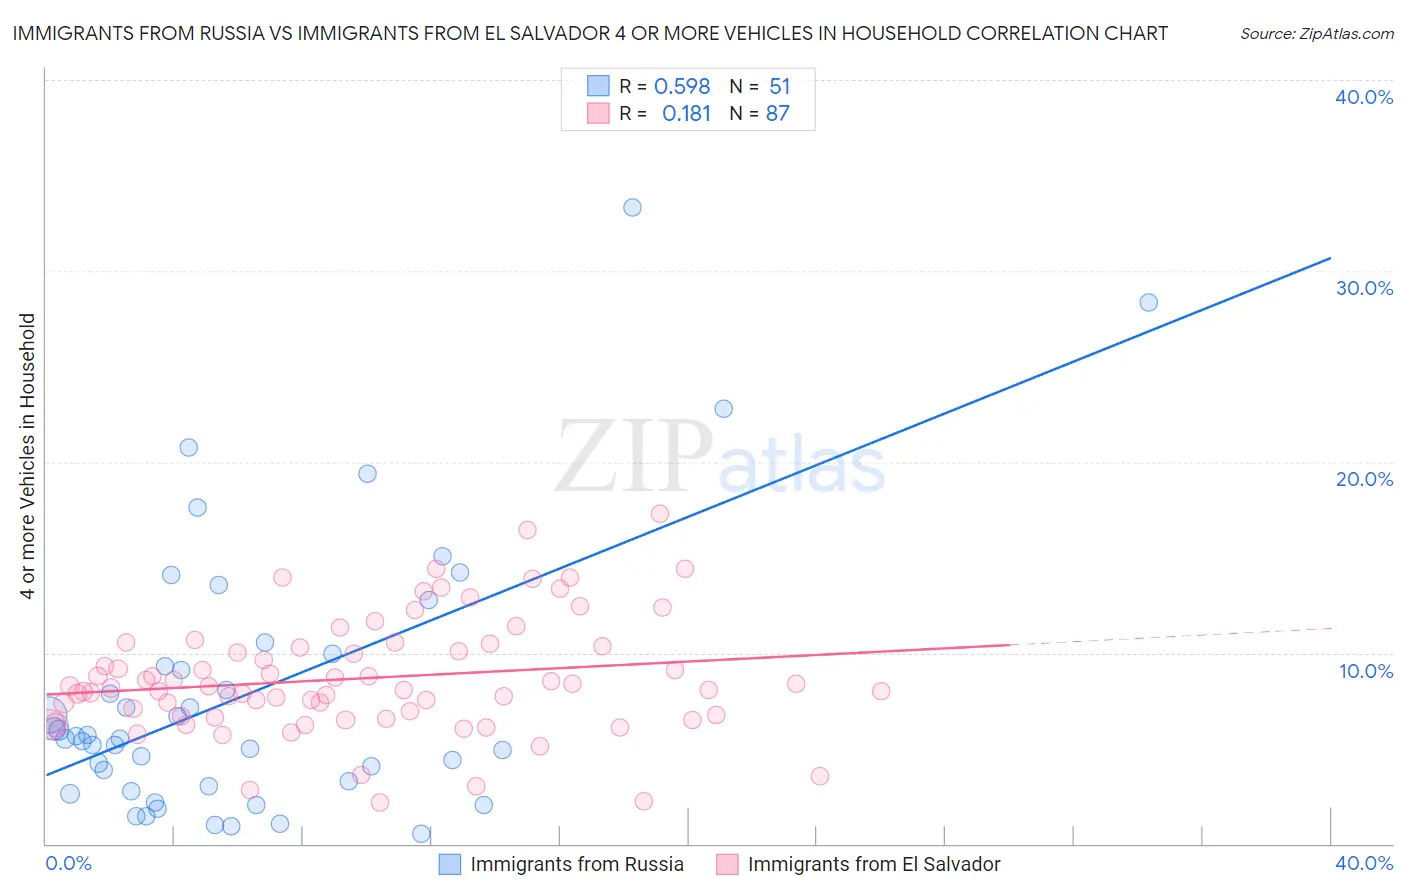
Immigrants from Russia vs Immigrants from El Salvador 4 or more Vehicles in Household Correlation Chart
The statistical analysis conducted on geographies consisting of 346,141,133 people shows a substantial positive correlation between the proportion of Immigrants from Russia and percentage of households with 4 or more vehicles available in the United States with a correlation coefficient (R) of 0.598 and weighted average of 5.3%. Similarly, the statistical analysis conducted on geographies consisting of 356,356,218 people shows a poor positive correlation between the proportion of Immigrants from El Salvador and percentage of households with 4 or more vehicles available in the United States with a correlation coefficient (R) of 0.181 and weighted average of 7.7%, a difference of 45.4%.
4 or more Vehicles in Household Correlation Summary
| Measurement | Immigrants from Russia | Immigrants from El Salvador |
| Minimum | 0.50% | 2.1% |
| Maximum | 33.3% | 17.3% |
| Range | 32.8% | 15.2% |
| Mean | 7.9% | 8.7% |
| Median | 5.5% | 8.2% |
| Interquartile 25% (IQ1) | 3.0% | 6.7% |
| Interquartile 75% (IQ3) | 9.9% | 10.4% |
| Interquartile Range (IQR) | 6.9% | 3.7% |
| Standard Deviation (Sample) | 7.1% | 3.0% |
| Standard Deviation (Population) | 7.1% | 3.0% |
Similar Demographics by 4 or more Vehicles in Household
Demographics Similar to Immigrants from Russia by 4 or more Vehicles in Household
In terms of 4 or more vehicles in household, the demographic groups most similar to Immigrants from Russia are Immigrants from Bosnia and Herzegovina (5.3%, a difference of 0.30%), Venezuelan (5.3%, a difference of 0.44%), Immigrants from Croatia (5.4%, a difference of 0.63%), Immigrants from Colombia (5.4%, a difference of 0.72%), and Immigrants from Liberia (5.4%, a difference of 0.76%).
| Demographics | Rating | Rank | 4 or more Vehicles in Household |
| Immigrants | Ireland | 0.3 /100 | #283 | Tragic 5.4% |
| Brazilians | 0.3 /100 | #284 | Tragic 5.4% |
| Immigrants | Liberia | 0.2 /100 | #285 | Tragic 5.4% |
| Immigrants | Colombia | 0.2 /100 | #286 | Tragic 5.4% |
| Immigrants | Croatia | 0.2 /100 | #287 | Tragic 5.4% |
| Venezuelans | 0.2 /100 | #288 | Tragic 5.3% |
| Immigrants | Bosnia and Herzegovina | 0.2 /100 | #289 | Tragic 5.3% |
| Immigrants | Russia | 0.2 /100 | #290 | Tragic 5.3% |
| Immigrants | Bahamas | 0.1 /100 | #291 | Tragic 5.3% |
| Liberians | 0.1 /100 | #292 | Tragic 5.3% |
| Immigrants | Congo | 0.1 /100 | #293 | Tragic 5.2% |
| Ghanaians | 0.1 /100 | #294 | Tragic 5.2% |
| Immigrants | Brazil | 0.1 /100 | #295 | Tragic 5.2% |
| Israelis | 0.1 /100 | #296 | Tragic 5.2% |
| Immigrants | Venezuela | 0.1 /100 | #297 | Tragic 5.2% |
Demographics Similar to Immigrants from El Salvador by 4 or more Vehicles in Household
In terms of 4 or more vehicles in household, the demographic groups most similar to Immigrants from El Salvador are Cherokee (7.7%, a difference of 0.16%), Swiss (7.8%, a difference of 0.35%), Immigrants from Laos (7.7%, a difference of 0.35%), Japanese (7.7%, a difference of 0.47%), and Osage (7.8%, a difference of 0.52%).
| Demographics | Rating | Rank | 4 or more Vehicles in Household |
| Fijians | 100.0 /100 | #43 | Exceptional 7.8% |
| Bhutanese | 100.0 /100 | #44 | Exceptional 7.8% |
| Choctaw | 100.0 /100 | #45 | Exceptional 7.8% |
| Crow | 100.0 /100 | #46 | Exceptional 7.8% |
| Osage | 100.0 /100 | #47 | Exceptional 7.8% |
| Swiss | 100.0 /100 | #48 | Exceptional 7.8% |
| Cherokee | 100.0 /100 | #49 | Exceptional 7.7% |
| Immigrants | El Salvador | 100.0 /100 | #50 | Exceptional 7.7% |
| Immigrants | Laos | 100.0 /100 | #51 | Exceptional 7.7% |
| Japanese | 100.0 /100 | #52 | Exceptional 7.7% |
| Malaysians | 100.0 /100 | #53 | Exceptional 7.7% |
| Dutch | 100.0 /100 | #54 | Exceptional 7.7% |
| Immigrants | Oceania | 100.0 /100 | #55 | Exceptional 7.6% |
| English | 100.0 /100 | #56 | Exceptional 7.6% |
| Pennsylvania Germans | 100.0 /100 | #57 | Exceptional 7.6% |