Immigrants from Russia vs Immigrants from Philippines 4 or more Vehicles in Household
COMPARE
Immigrants from Russia
Immigrants from Philippines
4 or more Vehicles in Household
4 or more Vehicles in Household Comparison
Immigrants from Russia
Immigrants from Philippines
5.3%
4 OR MORE VEHICLES IN HOUSEHOLD
0.2/ 100
METRIC RATING
290th/ 347
METRIC RANK
8.5%
4 OR MORE VEHICLES IN HOUSEHOLD
100.0/ 100
METRIC RATING
23rd/ 347
METRIC RANK
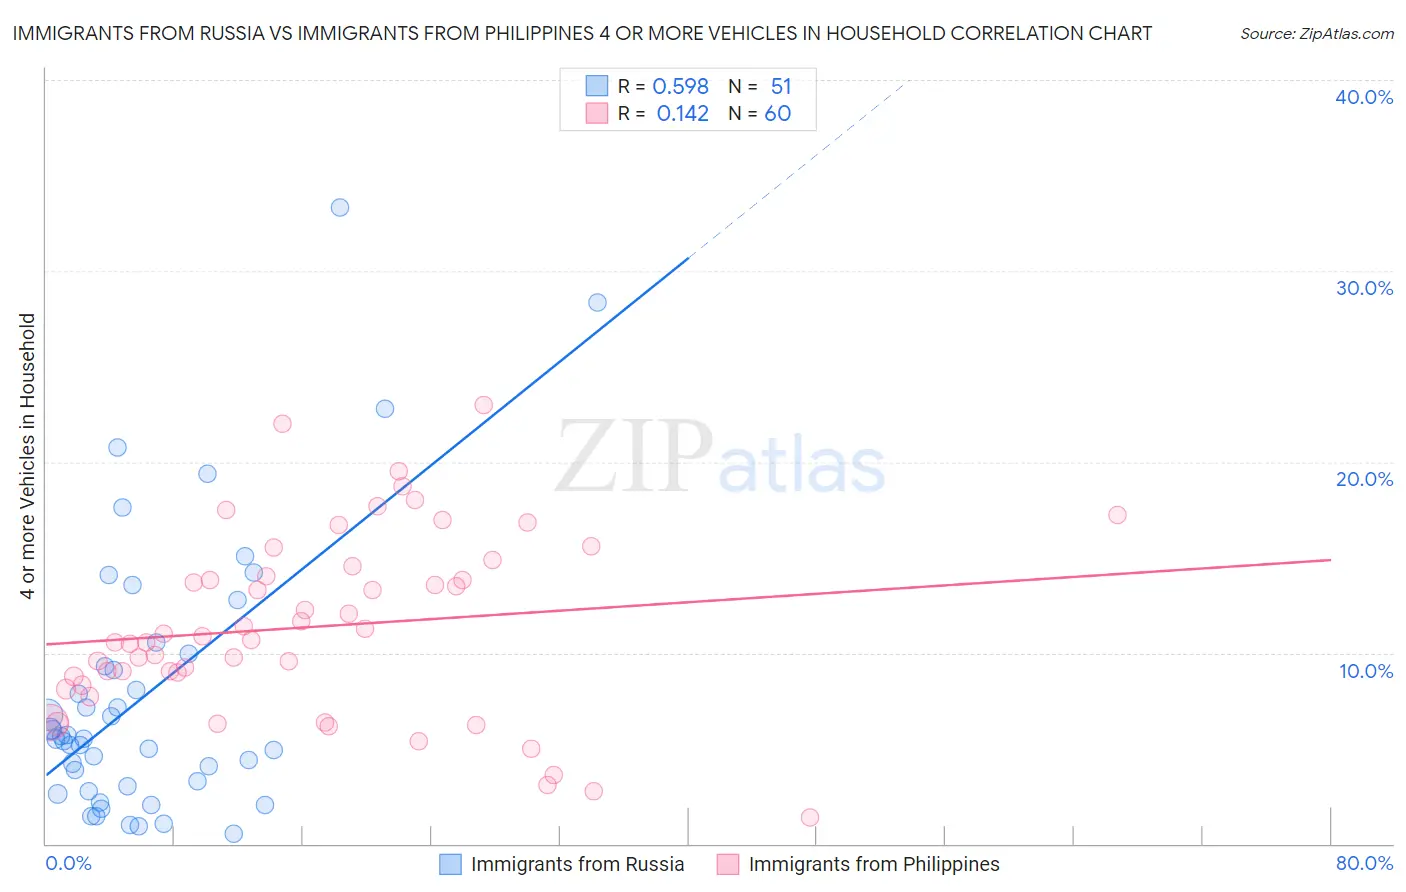
Immigrants from Russia vs Immigrants from Philippines 4 or more Vehicles in Household Correlation Chart
The statistical analysis conducted on geographies consisting of 346,141,133 people shows a substantial positive correlation between the proportion of Immigrants from Russia and percentage of households with 4 or more vehicles available in the United States with a correlation coefficient (R) of 0.598 and weighted average of 5.3%. Similarly, the statistical analysis conducted on geographies consisting of 469,114,664 people shows a poor positive correlation between the proportion of Immigrants from Philippines and percentage of households with 4 or more vehicles available in the United States with a correlation coefficient (R) of 0.142 and weighted average of 8.5%, a difference of 60.8%.
4 or more Vehicles in Household Correlation Summary
| Measurement | Immigrants from Russia | Immigrants from Philippines |
| Minimum | 0.50% | 1.4% |
| Maximum | 33.3% | 23.0% |
| Range | 32.8% | 21.6% |
| Mean | 7.9% | 11.4% |
| Median | 5.5% | 10.8% |
| Interquartile 25% (IQ1) | 3.0% | 8.5% |
| Interquartile 75% (IQ3) | 9.9% | 14.3% |
| Interquartile Range (IQR) | 6.9% | 5.7% |
| Standard Deviation (Sample) | 7.1% | 4.7% |
| Standard Deviation (Population) | 7.1% | 4.7% |
Similar Demographics by 4 or more Vehicles in Household
Demographics Similar to Immigrants from Russia by 4 or more Vehicles in Household
In terms of 4 or more vehicles in household, the demographic groups most similar to Immigrants from Russia are Immigrants from Bosnia and Herzegovina (5.3%, a difference of 0.30%), Venezuelan (5.3%, a difference of 0.44%), Immigrants from Croatia (5.4%, a difference of 0.63%), Immigrants from Colombia (5.4%, a difference of 0.72%), and Immigrants from Liberia (5.4%, a difference of 0.76%).
| Demographics | Rating | Rank | 4 or more Vehicles in Household |
| Immigrants | Ireland | 0.3 /100 | #283 | Tragic 5.4% |
| Brazilians | 0.3 /100 | #284 | Tragic 5.4% |
| Immigrants | Liberia | 0.2 /100 | #285 | Tragic 5.4% |
| Immigrants | Colombia | 0.2 /100 | #286 | Tragic 5.4% |
| Immigrants | Croatia | 0.2 /100 | #287 | Tragic 5.4% |
| Venezuelans | 0.2 /100 | #288 | Tragic 5.3% |
| Immigrants | Bosnia and Herzegovina | 0.2 /100 | #289 | Tragic 5.3% |
| Immigrants | Russia | 0.2 /100 | #290 | Tragic 5.3% |
| Immigrants | Bahamas | 0.1 /100 | #291 | Tragic 5.3% |
| Liberians | 0.1 /100 | #292 | Tragic 5.3% |
| Immigrants | Congo | 0.1 /100 | #293 | Tragic 5.2% |
| Ghanaians | 0.1 /100 | #294 | Tragic 5.2% |
| Immigrants | Brazil | 0.1 /100 | #295 | Tragic 5.2% |
| Israelis | 0.1 /100 | #296 | Tragic 5.2% |
| Immigrants | Venezuela | 0.1 /100 | #297 | Tragic 5.2% |
Demographics Similar to Immigrants from Philippines by 4 or more Vehicles in Household
In terms of 4 or more vehicles in household, the demographic groups most similar to Immigrants from Philippines are Immigrants from Vietnam (8.6%, a difference of 0.21%), Danish (8.6%, a difference of 0.26%), Pueblo (8.6%, a difference of 0.31%), Immigrants from Central America (8.5%, a difference of 0.82%), and Korean (8.6%, a difference of 1.1%).
| Demographics | Rating | Rank | 4 or more Vehicles in Household |
| Lumbee | 100.0 /100 | #16 | Exceptional 8.8% |
| Ute | 100.0 /100 | #17 | Exceptional 8.8% |
| Nepalese | 100.0 /100 | #18 | Exceptional 8.7% |
| Koreans | 100.0 /100 | #19 | Exceptional 8.6% |
| Pueblo | 100.0 /100 | #20 | Exceptional 8.6% |
| Danes | 100.0 /100 | #21 | Exceptional 8.6% |
| Immigrants | Vietnam | 100.0 /100 | #22 | Exceptional 8.6% |
| Immigrants | Philippines | 100.0 /100 | #23 | Exceptional 8.5% |
| Immigrants | Central America | 100.0 /100 | #24 | Exceptional 8.5% |
| Basques | 100.0 /100 | #25 | Exceptional 8.4% |
| Mexican American Indians | 100.0 /100 | #26 | Exceptional 8.4% |
| Sri Lankans | 100.0 /100 | #27 | Exceptional 8.4% |
| Cheyenne | 100.0 /100 | #28 | Exceptional 8.3% |
| Immigrants | South Eastern Asia | 100.0 /100 | #29 | Exceptional 8.2% |
| Navajo | 100.0 /100 | #30 | Exceptional 8.2% |