Immigrants from Russia vs Immigrants from Caribbean Doctorate Degree
COMPARE
Immigrants from Russia
Immigrants from Caribbean
Doctorate Degree
Doctorate Degree Comparison
Immigrants from Russia
Immigrants from Caribbean
2.5%
DOCTORATE DEGREE
100.0/ 100
METRIC RATING
41st/ 347
METRIC RANK
1.3%
DOCTORATE DEGREE
0.0/ 100
METRIC RATING
333rd/ 347
METRIC RANK
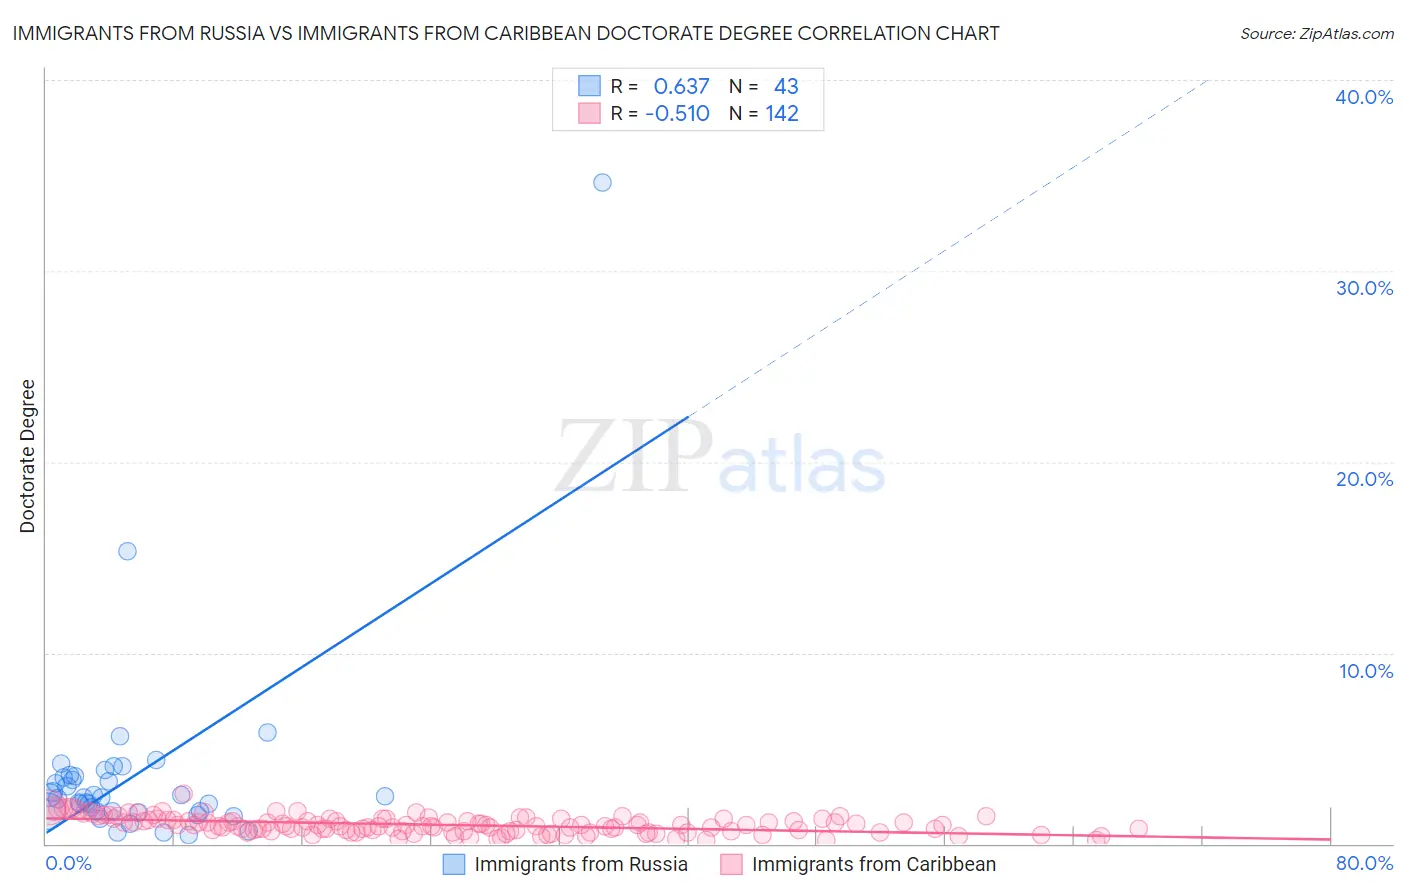
Immigrants from Russia vs Immigrants from Caribbean Doctorate Degree Correlation Chart
The statistical analysis conducted on geographies consisting of 346,147,144 people shows a significant positive correlation between the proportion of Immigrants from Russia and percentage of population with at least doctorate degree education in the United States with a correlation coefficient (R) of 0.637 and weighted average of 2.5%. Similarly, the statistical analysis conducted on geographies consisting of 443,887,060 people shows a substantial negative correlation between the proportion of Immigrants from Caribbean and percentage of population with at least doctorate degree education in the United States with a correlation coefficient (R) of -0.510 and weighted average of 1.3%, a difference of 96.7%.
Doctorate Degree Correlation Summary
| Measurement | Immigrants from Russia | Immigrants from Caribbean |
| Minimum | 0.49% | 0.18% |
| Maximum | 34.6% | 2.6% |
| Range | 34.1% | 2.5% |
| Mean | 3.6% | 1.00% |
| Median | 2.4% | 0.96% |
| Interquartile 25% (IQ1) | 1.7% | 0.67% |
| Interquartile 75% (IQ3) | 3.5% | 1.3% |
| Interquartile Range (IQR) | 1.8% | 0.61% |
| Standard Deviation (Sample) | 5.4% | 0.44% |
| Standard Deviation (Population) | 5.3% | 0.44% |
Similar Demographics by Doctorate Degree
Demographics Similar to Immigrants from Russia by Doctorate Degree
In terms of doctorate degree, the demographic groups most similar to Immigrants from Russia are Estonian (2.5%, a difference of 0.33%), New Zealander (2.5%, a difference of 0.63%), Immigrants from Ireland (2.5%, a difference of 0.74%), Russian (2.6%, a difference of 1.2%), and Immigrants from Kuwait (2.6%, a difference of 1.4%).
| Demographics | Rating | Rank | Doctorate Degree |
| Cypriots | 100.0 /100 | #34 | Exceptional 2.6% |
| Immigrants | Malaysia | 100.0 /100 | #35 | Exceptional 2.6% |
| Immigrants | Spain | 100.0 /100 | #36 | Exceptional 2.6% |
| Immigrants | Kuwait | 100.0 /100 | #37 | Exceptional 2.6% |
| Russians | 100.0 /100 | #38 | Exceptional 2.6% |
| Immigrants | Ireland | 100.0 /100 | #39 | Exceptional 2.5% |
| Estonians | 100.0 /100 | #40 | Exceptional 2.5% |
| Immigrants | Russia | 100.0 /100 | #41 | Exceptional 2.5% |
| New Zealanders | 100.0 /100 | #42 | Exceptional 2.5% |
| Soviet Union | 100.0 /100 | #43 | Exceptional 2.5% |
| Immigrants | Netherlands | 100.0 /100 | #44 | Exceptional 2.5% |
| Immigrants | South Africa | 100.0 /100 | #45 | Exceptional 2.4% |
| Immigrants | Austria | 100.0 /100 | #46 | Exceptional 2.4% |
| Immigrants | Western Europe | 100.0 /100 | #47 | Exceptional 2.4% |
| Asians | 100.0 /100 | #48 | Exceptional 2.4% |
Demographics Similar to Immigrants from Caribbean by Doctorate Degree
In terms of doctorate degree, the demographic groups most similar to Immigrants from Caribbean are Yakama (1.3%, a difference of 0.16%), Immigrants from Dominican Republic (1.3%, a difference of 0.19%), Immigrants from Latin America (1.3%, a difference of 1.7%), Yup'ik (1.3%, a difference of 1.8%), and Haitian (1.3%, a difference of 2.0%).
| Demographics | Rating | Rank | Doctorate Degree |
| Immigrants | Cabo Verde | 0.0 /100 | #326 | Tragic 1.3% |
| Hispanics or Latinos | 0.0 /100 | #327 | Tragic 1.3% |
| Inupiat | 0.0 /100 | #328 | Tragic 1.3% |
| Haitians | 0.0 /100 | #329 | Tragic 1.3% |
| Yup'ik | 0.0 /100 | #330 | Tragic 1.3% |
| Immigrants | Latin America | 0.0 /100 | #331 | Tragic 1.3% |
| Yakama | 0.0 /100 | #332 | Tragic 1.3% |
| Immigrants | Caribbean | 0.0 /100 | #333 | Tragic 1.3% |
| Immigrants | Dominican Republic | 0.0 /100 | #334 | Tragic 1.3% |
| Immigrants | Haiti | 0.0 /100 | #335 | Tragic 1.3% |
| Nepalese | 0.0 /100 | #336 | Tragic 1.3% |
| Bangladeshis | 0.0 /100 | #337 | Tragic 1.2% |
| Puget Sound Salish | 0.0 /100 | #338 | Tragic 1.2% |
| Immigrants | Central America | 0.0 /100 | #339 | Tragic 1.2% |
| Immigrants | Cuba | 0.0 /100 | #340 | Tragic 1.2% |