Immigrants from Russia vs Bermudan 11th Grade
COMPARE
Immigrants from Russia
Bermudan
11th Grade
11th Grade Comparison
Immigrants from Russia
Bermudans
93.3%
11TH GRADE
96.6/ 100
METRIC RATING
120th/ 347
METRIC RANK
92.6%
11TH GRADE
62.3/ 100
METRIC RATING
166th/ 347
METRIC RANK
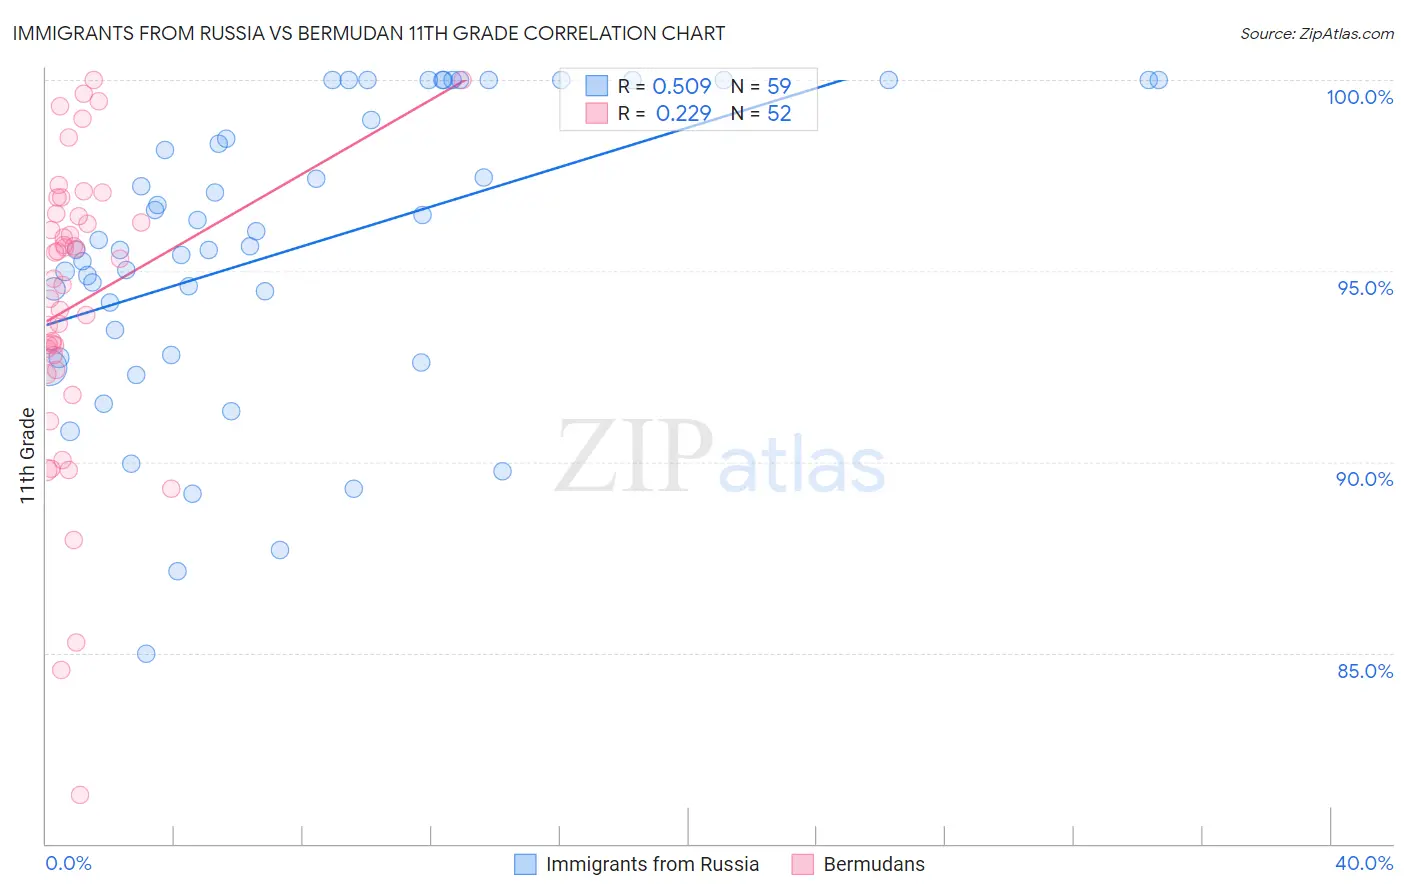
Immigrants from Russia vs Bermudan 11th Grade Correlation Chart
The statistical analysis conducted on geographies consisting of 347,948,494 people shows a substantial positive correlation between the proportion of Immigrants from Russia and percentage of population with at least 11th grade education in the United States with a correlation coefficient (R) of 0.509 and weighted average of 93.3%. Similarly, the statistical analysis conducted on geographies consisting of 55,730,379 people shows a weak positive correlation between the proportion of Bermudans and percentage of population with at least 11th grade education in the United States with a correlation coefficient (R) of 0.229 and weighted average of 92.6%, a difference of 0.70%.
11th Grade Correlation Summary
| Measurement | Immigrants from Russia | Bermudan |
| Minimum | 85.0% | 81.3% |
| Maximum | 100.0% | 100.0% |
| Range | 15.0% | 18.7% |
| Mean | 95.6% | 94.1% |
| Median | 95.7% | 95.1% |
| Interquartile 25% (IQ1) | 92.8% | 92.6% |
| Interquartile 75% (IQ3) | 100.0% | 96.5% |
| Interquartile Range (IQR) | 7.2% | 3.9% |
| Standard Deviation (Sample) | 3.8% | 3.9% |
| Standard Deviation (Population) | 3.8% | 3.9% |
Similar Demographics by 11th Grade
Demographics Similar to Immigrants from Russia by 11th Grade
In terms of 11th grade, the demographic groups most similar to Immigrants from Russia are German Russian (93.3%, a difference of 0.020%), Immigrants from Belarus (93.3%, a difference of 0.020%), Immigrants from Korea (93.3%, a difference of 0.030%), Israeli (93.3%, a difference of 0.030%), and Immigrants from Greece (93.2%, a difference of 0.050%).
| Demographics | Rating | Rank | 11th Grade |
| Immigrants | Zimbabwe | 97.8 /100 | #113 | Exceptional 93.4% |
| Jordanians | 97.8 /100 | #114 | Exceptional 93.4% |
| Palestinians | 97.7 /100 | #115 | Exceptional 93.4% |
| Immigrants | Hungary | 97.5 /100 | #116 | Exceptional 93.4% |
| Whites/Caucasians | 97.4 /100 | #117 | Exceptional 93.3% |
| Immigrants | Korea | 97.0 /100 | #118 | Exceptional 93.3% |
| Israelis | 97.0 /100 | #119 | Exceptional 93.3% |
| Immigrants | Russia | 96.6 /100 | #120 | Exceptional 93.3% |
| German Russians | 96.4 /100 | #121 | Exceptional 93.3% |
| Immigrants | Belarus | 96.3 /100 | #122 | Exceptional 93.3% |
| Immigrants | Greece | 95.9 /100 | #123 | Exceptional 93.2% |
| Immigrants | Eastern Europe | 95.9 /100 | #124 | Exceptional 93.2% |
| Immigrants | Sri Lanka | 95.6 /100 | #125 | Exceptional 93.2% |
| Basques | 95.2 /100 | #126 | Exceptional 93.2% |
| Immigrants | Kazakhstan | 92.4 /100 | #127 | Exceptional 93.1% |
Demographics Similar to Bermudans by 11th Grade
In terms of 11th grade, the demographic groups most similar to Bermudans are Immigrants from Iraq (92.6%, a difference of 0.010%), Alsatian (92.6%, a difference of 0.020%), Spanish (92.7%, a difference of 0.040%), Sierra Leonean (92.6%, a difference of 0.040%), and Nonimmigrants (92.7%, a difference of 0.050%).
| Demographics | Rating | Rank | 11th Grade |
| Americans | 71.7 /100 | #159 | Good 92.7% |
| Immigrants | Lebanon | 70.7 /100 | #160 | Good 92.7% |
| Immigrants | Argentina | 69.8 /100 | #161 | Good 92.7% |
| Paraguayans | 68.7 /100 | #162 | Good 92.7% |
| Immigrants | Nonimmigrants | 66.6 /100 | #163 | Good 92.7% |
| Spanish | 66.2 /100 | #164 | Good 92.7% |
| Immigrants | Iraq | 63.7 /100 | #165 | Good 92.6% |
| Bermudans | 62.3 /100 | #166 | Good 92.6% |
| Alsatians | 60.2 /100 | #167 | Good 92.6% |
| Sierra Leoneans | 58.7 /100 | #168 | Average 92.6% |
| Immigrants | Albania | 57.8 /100 | #169 | Average 92.6% |
| Immigrants | Northern Africa | 57.3 /100 | #170 | Average 92.6% |
| Laotians | 54.4 /100 | #171 | Average 92.6% |
| Immigrants | Pakistan | 52.3 /100 | #172 | Average 92.5% |
| Indians (Asian) | 51.5 /100 | #173 | Average 92.5% |