Immigrants from Romania vs Guatemalan 2 or more Vehicles in Household

COMPARE

Immigrants from Romania
Race
Ancestry
AfghanAfricanAlaska NativeAlaskan AthabascanAlbanianAleutAlsatianAmericanApacheArabArapahoArgentineanArmenianAssyrian/Chaldean/SyriacAustralianAustrianBahamianBangladeshiBarbadianBasqueBelgianBelizeanBermudanBhutaneseBlackfeetBolivianBrazilianBritishBritish West IndianBulgarianBurmeseCajunCambodianCanadianCape VerdeanCarpatho RusynCelticCentral AmericanCentral American IndianCherokeeCheyenneChickasawChileanChineseChippewaChoctawColombianColvilleComancheCosta RicanCreeCreekCroatianCrowCubanCypriotCzechCzechoslovakianDanishDelawareDominicanDutchDutch West IndianEastern EuropeanEcuadorianEgyptianEnglishEstonianEthiopianEuropeanFijianFilipinoFinnishFrenchFrench American IndianFrench CanadianGermanGerman RussianGhanaianGreekGuamanian/ChamorroGuyaneseHaitianHmongHonduranHopiHoumaHungarianIcelanderIndian (Asian)IndonesianInupiatIranianIraqiIrishIroquoisIsraeliItalianJamaicanJapaneseJordanianKenyanKiowaKoreanLaotianLatvianLebaneseLiberianLithuanianLumbeeLuxembourgerMacedonianMalaysianMalteseMarshalleseMenomineeMexicanMexican American IndianMongolianMoroccanNative HawaiianNavajoNepaleseNew ZealanderNicaraguanNigerianNorthern EuropeanNorwegianOkinawanOsageOttawaPaiutePakistaniPalestinianPanamanianParaguayanPennsylvania GermanPeruvianPimaPolishPortuguesePotawatomiPuebloPuerto RicanPuget Sound SalishRomanianRussianSalvadoranSamoanScandinavianScotch-IrishScottishSeminoleSenegaleseSerbianShoshoneSierra LeoneanSiouxSlavicSlovakSloveneSomaliSouth AfricanSouth AmericanSouth American IndianSoviet UnionSpaniardSpanishSpanish AmericanSpanish American IndianSri LankanSubsaharan AfricanSudaneseSwedishSwissSyrianTaiwaneseThaiTlingit-HaidaTohono O'OdhamTonganTrinidadian and TobagonianTsimshianTurkishU.S. Virgin IslanderUgandanUkrainianUruguayanUteVenezuelanVietnameseWelshWest IndianYakamaYaquiYugoslavianYumanYup'ikZimbabwean
Immigration
NonimmigrantsImmigrantsAfghanistanAfricaAlbaniaArgentinaArmeniaAsiaAustraliaAustriaBahamasBangladeshBarbadosBelarusBelgiumBelizeBoliviaBosnia and HerzegovinaBrazilBulgariaBurma/MyanmarCabo VerdeCambodiaCameroonCanadaCaribbeanCentral AmericaChileChinaColombiaCongoCosta RicaCroatiaCubaCzechoslovakiaDenmarkDominicaDominican RepublicEastern AfricaEastern AsiaEastern EuropeEcuadorEgyptEl SalvadorEnglandEritreaEthiopiaEuropeFijiFranceGermanyGhanaGreeceGrenadaGuatemalaGuyanaHaitiHondurasHong KongHungaryIndiaIndonesiaIranIraqIrelandIsraelItalyJamaicaJapanJordanKazakhstanKenyaKoreaKuwaitLaosLatin AmericaLatviaLebanonLiberiaLithuaniaMalaysiaMexicoMicronesiaMiddle AfricaMoldovaMoroccoNepalNetherlandsNicaraguaNigeriaNorth AmericaNorth MacedoniaNorthern AfricaNorthern EuropeNorwayOceaniaPakistanPanamaPeruPhilippinesPolandPortugalRomaniaRussiaSaudi ArabiaScotlandSenegalSerbiaSierra LeoneSingaporeSomaliaSouth AfricaSouth AmericaSouth Central AsiaSouth Eastern AsiaSouthern EuropeSpainSri LankaSt. Vincent and the GrenadinesSudanSwedenSwitzerlandSyriaTaiwanThailandTrinidad and TobagoTurkeyUgandaUkraineUruguayUzbekistanVenezuelaVietnamWest IndiesWestern AfricaWestern AsiaWestern EuropeYemenZaireZimbabweAzores
Guatemalan
Race
Ancestry
AfghanAfricanAlaska NativeAlaskan AthabascanAlbanianAleutAlsatianAmericanApacheArabArapahoArgentineanArmenianAssyrian/Chaldean/SyriacAustralianAustrianBahamianBangladeshiBarbadianBasqueBelgianBelizeanBermudanBhutaneseBlackfeetBolivianBrazilianBritishBritish West IndianBulgarianBurmeseCajunCambodianCanadianCape VerdeanCarpatho RusynCelticCentral AmericanCentral American IndianCherokeeCheyenneChickasawChileanChineseChippewaChoctawColombianColvilleComancheCosta RicanCreeCreekCroatianCrowCubanCypriotCzechCzechoslovakianDanishDelawareDominicanDutchDutch West IndianEastern EuropeanEcuadorianEgyptianEnglishEstonianEthiopianEuropeanFijianFilipinoFinnishFrenchFrench American IndianFrench CanadianGermanGerman RussianGhanaianGreekGuamanian/ChamorroGuatemalanGuyaneseHaitianHmongHonduranHopiHoumaHungarianIcelanderIndian (Asian)IndonesianInupiatIranianIraqiIrishIroquoisIsraeliItalianJamaicanJapaneseJordanianKenyanKiowaKoreanLaotianLatvianLebaneseLiberianLithuanianLumbeeLuxembourgerMacedonianMalaysianMalteseMarshalleseMenomineeMexicanMexican American IndianMongolianMoroccanNative HawaiianNavajoNepaleseNew ZealanderNicaraguanNigerianNorthern EuropeanNorwegianOkinawanOsageOttawaPaiutePakistaniPalestinianPanamanianParaguayanPennsylvania GermanPeruvianPimaPolishPortuguesePotawatomiPuebloPuerto RicanPuget Sound SalishRomanianRussianSalvadoranSamoanScandinavianScotch-IrishScottishSeminoleSenegaleseSerbianShoshoneSierra LeoneanSiouxSlavicSlovakSloveneSomaliSouth AfricanSouth AmericanSouth American IndianSoviet UnionSpaniardSpanishSpanish AmericanSpanish American IndianSri LankanSubsaharan AfricanSudaneseSwedishSwissSyrianTaiwaneseThaiTlingit-HaidaTohono O'OdhamTonganTrinidadian and TobagonianTsimshianTurkishU.S. Virgin IslanderUgandanUkrainianUruguayanUteVenezuelanVietnameseWelshWest IndianYakamaYaquiYugoslavianYumanYup'ikZimbabwean
Immigration
NonimmigrantsImmigrantsAfghanistanAfricaAlbaniaArgentinaArmeniaAsiaAustraliaAustriaBahamasBangladeshBarbadosBelarusBelgiumBelizeBoliviaBosnia and HerzegovinaBrazilBulgariaBurma/MyanmarCabo VerdeCambodiaCameroonCanadaCaribbeanCentral AmericaChileChinaColombiaCongoCosta RicaCroatiaCubaCzechoslovakiaDenmarkDominicaDominican RepublicEastern AfricaEastern AsiaEastern EuropeEcuadorEgyptEl SalvadorEnglandEritreaEthiopiaEuropeFijiFranceGermanyGhanaGreeceGrenadaGuatemalaGuyanaHaitiHondurasHong KongHungaryIndiaIndonesiaIranIraqIrelandIsraelItalyJamaicaJapanJordanKazakhstanKenyaKoreaKuwaitLaosLatin AmericaLatviaLebanonLiberiaLithuaniaMalaysiaMexicoMicronesiaMiddle AfricaMoldovaMoroccoNepalNetherlandsNicaraguaNigeriaNorth AmericaNorth MacedoniaNorthern AfricaNorthern EuropeNorwayOceaniaPakistanPanamaPeruPhilippinesPolandPortugalRussiaSaudi ArabiaScotlandSenegalSerbiaSierra LeoneSingaporeSomaliaSouth AfricaSouth AmericaSouth Central AsiaSouth Eastern AsiaSouthern EuropeSpainSri LankaSt. Vincent and the GrenadinesSudanSwedenSwitzerlandSyriaTaiwanThailandTrinidad and TobagoTurkeyUgandaUkraineUruguayUzbekistanVenezuelaVietnamWest IndiesWestern AfricaWestern AsiaWestern EuropeYemenZaireZimbabweAzores
2 or more Vehicles in Household
Income
Poverty
Unemployment
Labor Participation
Family Structure
Vehicle Availability
Education Level
Disability

2 or more Vehicles in Household Comparison

Immigrants from Romania

Guatemalans

Fair
Tragic
54.7%
2 OR MORE VEHICLES IN HOUSEHOLD
23.8/ 100
METRIC RATING
192nd/ 347
METRIC RANK
54.1%
2 OR MORE VEHICLES IN HOUSEHOLD
9.6/ 100
METRIC RATING
213th/ 347
METRIC RANK

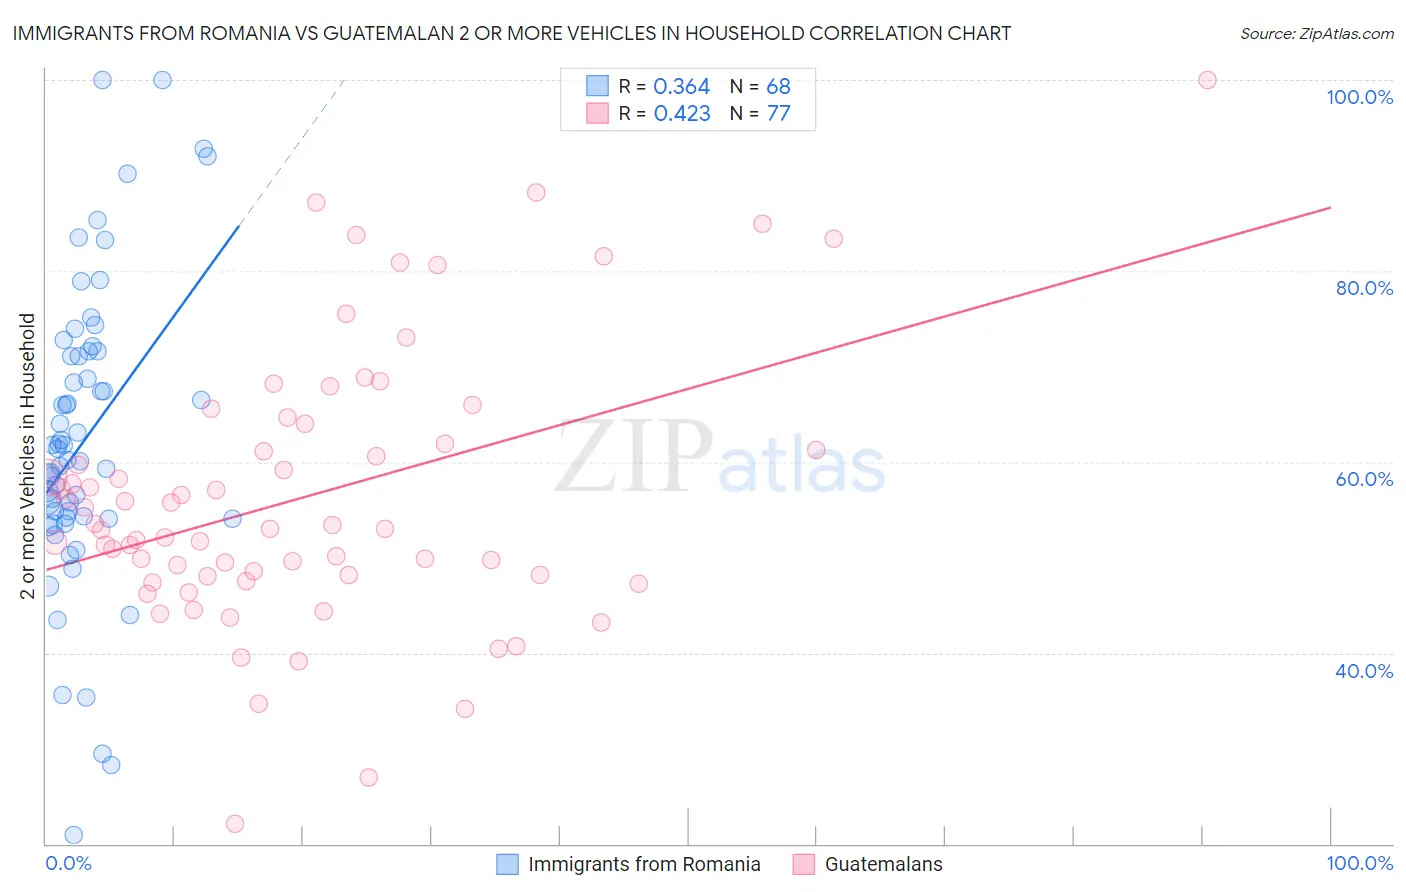
Immigrants from Romania vs Guatemalan 2 or more Vehicles in Household Correlation Chart

The statistical analysis conducted on geographies consisting of 256,931,025 people shows a mild positive correlation between the proportion of Immigrants from Romania and percentage of households with 2 or more vehicles available in the United States with a correlation coefficient (R) of 0.364 and weighted average of 54.7%. Similarly, the statistical analysis conducted on geographies consisting of 409,337,767 people shows a moderate positive correlation between the proportion of Guatemalans and percentage of households with 2 or more vehicles available in the United States with a correlation coefficient (R) of 0.423 and weighted average of 54.1%, a difference of 1.1%.
Immigrants from Romania vs Guatemalan 2 or more Vehicles in Household

2 or more Vehicles in Household Correlation Summary

MeasurementImmigrants from RomaniaGuatemalan
Minimum20.9%22.0%
Maximum100.0%100.0%
Range79.1%78.0%
Mean62.3%56.4%
Median60.8%53.1%
Interquartile 25% (IQ1)54.1%48.1%
Interquartile 75% (IQ3)71.3%63.0%
Interquartile Range (IQR)17.2%14.9%
Standard Deviation (Sample)15.6%14.4%
Standard Deviation (Population)15.5%14.3%

Similar Demographics by 2 or more Vehicles in Household

Demographics Similar to Immigrants from Romania by 2 or more Vehicles in Household

In terms of 2 or more vehicles in household, the demographic groups most similar to Immigrants from Romania are Immigrants from Japan (54.7%, a difference of 0.020%), Central American (54.7%, a difference of 0.050%), Immigrants (54.7%, a difference of 0.060%), Iroquois (54.7%, a difference of 0.070%), and Russian (54.8%, a difference of 0.13%).
DemographicsRating | Rank2 or more Vehicles in Household
Arabs
35.9
/100
|
#185
Fair
55.0%
Peruvians
33.7
/100
|
#186
Fair
55.0%
Immigrants | Uganda
33.4
/100
|
#187
Fair
55.0%
Marshallese
30.5
/100
|
#188
Fair
54.9%
Eastern Europeans
27.5
/100
|
#189
Fair
54.8%
Russians
26.3
/100
|
#190
Fair
54.8%
Immigrants | Immigrants
25.0
/100
|
#191
Fair
54.7%
Immigrants | Romania
23.8
/100
|
#192
Fair
54.7%
Immigrants | Japan
23.4
/100
|
#193
Fair
54.7%
Central Americans
23.0
/100
|
#194
Fair
54.7%
Iroquois
22.6
/100
|
#195
Fair
54.7%
Immigrants | Poland
19.3
/100
|
#196
Poor
54.6%
Argentineans
17.5
/100
|
#197
Poor
54.5%
Carpatho Rusyns
16.2
/100
|
#198
Poor
54.4%
Immigrants | Norway
15.9
/100
|
#199
Poor
54.4%

Demographics Similar to Guatemalans by 2 or more Vehicles in Household

In terms of 2 or more vehicles in household, the demographic groups most similar to Guatemalans are Immigrants from Czechoslovakia (54.1%, a difference of 0.020%), Aleut (54.1%, a difference of 0.030%), Immigrants from Western Asia (54.1%, a difference of 0.040%), Immigrants from Chile (54.2%, a difference of 0.16%), and Immigrants from Saudi Arabia (54.2%, a difference of 0.19%).
DemographicsRating | Rank2 or more Vehicles in Household
Immigrants | Latin America
13.1
/100
|
#206
Poor
54.3%
Turks
13.0
/100
|
#207
Poor
54.3%
Egyptians
12.0
/100
|
#208
Poor
54.3%
Immigrants | Bulgaria
12.0
/100
|
#209
Poor
54.3%
Immigrants | Saudi Arabia
11.3
/100
|
#210
Poor
54.2%
Immigrants | Hungary
11.3
/100
|
#211
Poor
54.2%
Immigrants | Chile
11.1
/100
|
#212
Poor
54.2%
Guatemalans
9.6
/100
|
#213
Tragic
54.1%
Immigrants | Czechoslovakia
9.4
/100
|
#214
Tragic
54.1%
Aleuts
9.3
/100
|
#215
Tragic
54.1%
Immigrants | Western Asia
9.3
/100
|
#216
Tragic
54.1%
Immigrants | Burma/Myanmar
7.1
/100
|
#217
Tragic
53.9%
Immigrants | Argentina
6.8
/100
|
#218
Tragic
53.9%
South American Indians
6.5
/100
|
#219
Tragic
53.9%
Taiwanese
6.3
/100
|
#220
Tragic
53.9%