Fijian vs Asian 3 or more Vehicles in Household
COMPARE
Fijian
Asian
3 or more Vehicles in Household
3 or more Vehicles in Household Comparison
Fijians
Asians
22.2%
3 OR MORE VEHICLES IN HOUSEHOLD
99.9/ 100
METRIC RATING
62nd/ 347
METRIC RANK
20.8%
3 OR MORE VEHICLES IN HOUSEHOLD
96.8/ 100
METRIC RATING
110th/ 347
METRIC RANK
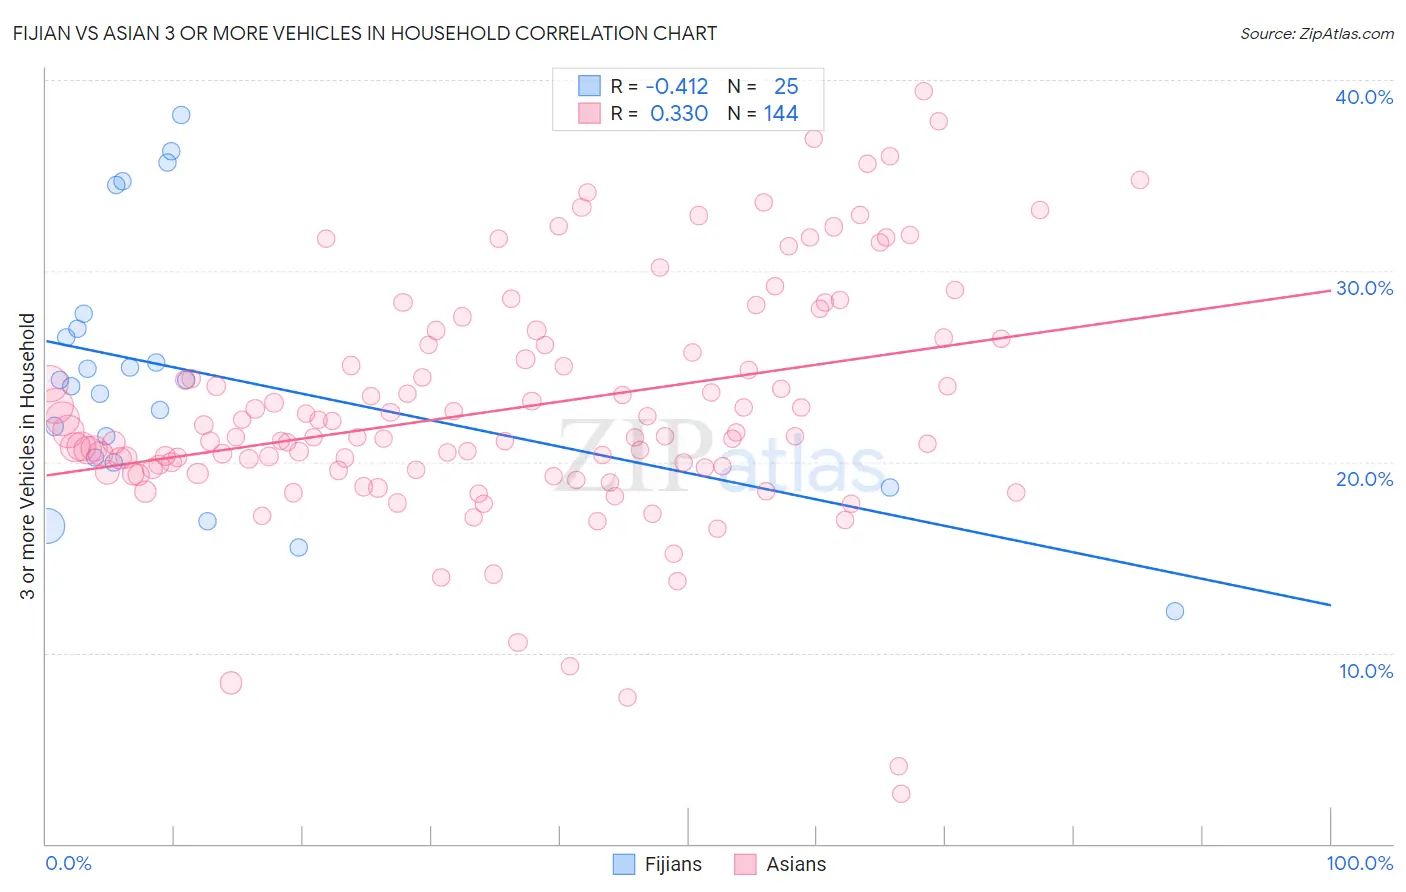
Fijian vs Asian 3 or more Vehicles in Household Correlation Chart
The statistical analysis conducted on geographies consisting of 55,946,272 people shows a moderate negative correlation between the proportion of Fijians and percentage of households with 3 or more vehicles available in the United States with a correlation coefficient (R) of -0.412 and weighted average of 22.2%. Similarly, the statistical analysis conducted on geographies consisting of 549,911,489 people shows a mild positive correlation between the proportion of Asians and percentage of households with 3 or more vehicles available in the United States with a correlation coefficient (R) of 0.330 and weighted average of 20.8%, a difference of 7.1%.
3 or more Vehicles in Household Correlation Summary
| Measurement | Fijian | Asian |
| Minimum | 12.2% | 2.6% |
| Maximum | 38.1% | 39.4% |
| Range | 26.0% | 36.8% |
| Mean | 24.7% | 22.8% |
| Median | 24.3% | 21.3% |
| Interquartile 25% (IQ1) | 20.1% | 19.6% |
| Interquartile 75% (IQ3) | 27.4% | 26.1% |
| Interquartile Range (IQR) | 7.3% | 6.5% |
| Standard Deviation (Sample) | 6.8% | 6.3% |
| Standard Deviation (Population) | 6.7% | 6.2% |
Similar Demographics by 3 or more Vehicles in Household
Demographics Similar to Fijians by 3 or more Vehicles in Household
In terms of 3 or more vehicles in household, the demographic groups most similar to Fijians are Bhutanese (22.2%, a difference of 0.040%), Chickasaw (22.2%, a difference of 0.16%), Finnish (22.3%, a difference of 0.20%), Navajo (22.3%, a difference of 0.28%), and Spaniard (22.3%, a difference of 0.35%).
| Demographics | Rating | Rank | 3 or more Vehicles in Household |
| Immigrants | Laos | 100.0 /100 | #55 | Exceptional 22.4% |
| Hispanics or Latinos | 100.0 /100 | #56 | Exceptional 22.4% |
| Pennsylvania Germans | 100.0 /100 | #57 | Exceptional 22.3% |
| Spaniards | 100.0 /100 | #58 | Exceptional 22.3% |
| Navajo | 100.0 /100 | #59 | Exceptional 22.3% |
| Finns | 99.9 /100 | #60 | Exceptional 22.3% |
| Bhutanese | 99.9 /100 | #61 | Exceptional 22.2% |
| Fijians | 99.9 /100 | #62 | Exceptional 22.2% |
| Chickasaw | 99.9 /100 | #63 | Exceptional 22.2% |
| Immigrants | Taiwan | 99.9 /100 | #64 | Exceptional 22.1% |
| Pima | 99.9 /100 | #65 | Exceptional 22.0% |
| Northern Europeans | 99.9 /100 | #66 | Exceptional 22.0% |
| Alaskan Athabascans | 99.9 /100 | #67 | Exceptional 21.9% |
| British | 99.9 /100 | #68 | Exceptional 21.9% |
| Creek | 99.9 /100 | #69 | Exceptional 21.9% |
Demographics Similar to Asians by 3 or more Vehicles in Household
In terms of 3 or more vehicles in household, the demographic groups most similar to Asians are Immigrants from Micronesia (20.7%, a difference of 0.030%), Filipino (20.8%, a difference of 0.14%), Immigrants from Scotland (20.8%, a difference of 0.20%), Nicaraguan (20.7%, a difference of 0.32%), and Immigrants from England (20.7%, a difference of 0.33%).
| Demographics | Rating | Rank | 3 or more Vehicles in Household |
| Dutch West Indians | 97.8 /100 | #103 | Exceptional 20.9% |
| Luxembourgers | 97.7 /100 | #104 | Exceptional 20.9% |
| Austrians | 97.5 /100 | #105 | Exceptional 20.9% |
| Bolivians | 97.4 /100 | #106 | Exceptional 20.8% |
| Immigrants | Germany | 97.4 /100 | #107 | Exceptional 20.8% |
| Immigrants | Scotland | 97.1 /100 | #108 | Exceptional 20.8% |
| Filipinos | 97.0 /100 | #109 | Exceptional 20.8% |
| Asians | 96.8 /100 | #110 | Exceptional 20.8% |
| Immigrants | Micronesia | 96.7 /100 | #111 | Exceptional 20.7% |
| Nicaraguans | 96.2 /100 | #112 | Exceptional 20.7% |
| Immigrants | England | 96.2 /100 | #113 | Exceptional 20.7% |
| Burmese | 95.8 /100 | #114 | Exceptional 20.6% |
| French Canadians | 95.0 /100 | #115 | Exceptional 20.6% |
| Italians | 94.9 /100 | #116 | Exceptional 20.6% |
| Croatians | 94.9 /100 | #117 | Exceptional 20.6% |