Immigrants from Philippines vs Indonesian 2 or more Vehicles in Household
COMPARE
Immigrants from Philippines
Indonesian
2 or more Vehicles in Household
2 or more Vehicles in Household Comparison
Immigrants from Philippines
Indonesians
60.1%
2 OR MORE VEHICLES IN HOUSEHOLD
100.0/ 100
METRIC RATING
35th/ 347
METRIC RANK
53.4%
2 OR MORE VEHICLES IN HOUSEHOLD
2.7/ 100
METRIC RATING
236th/ 347
METRIC RANK
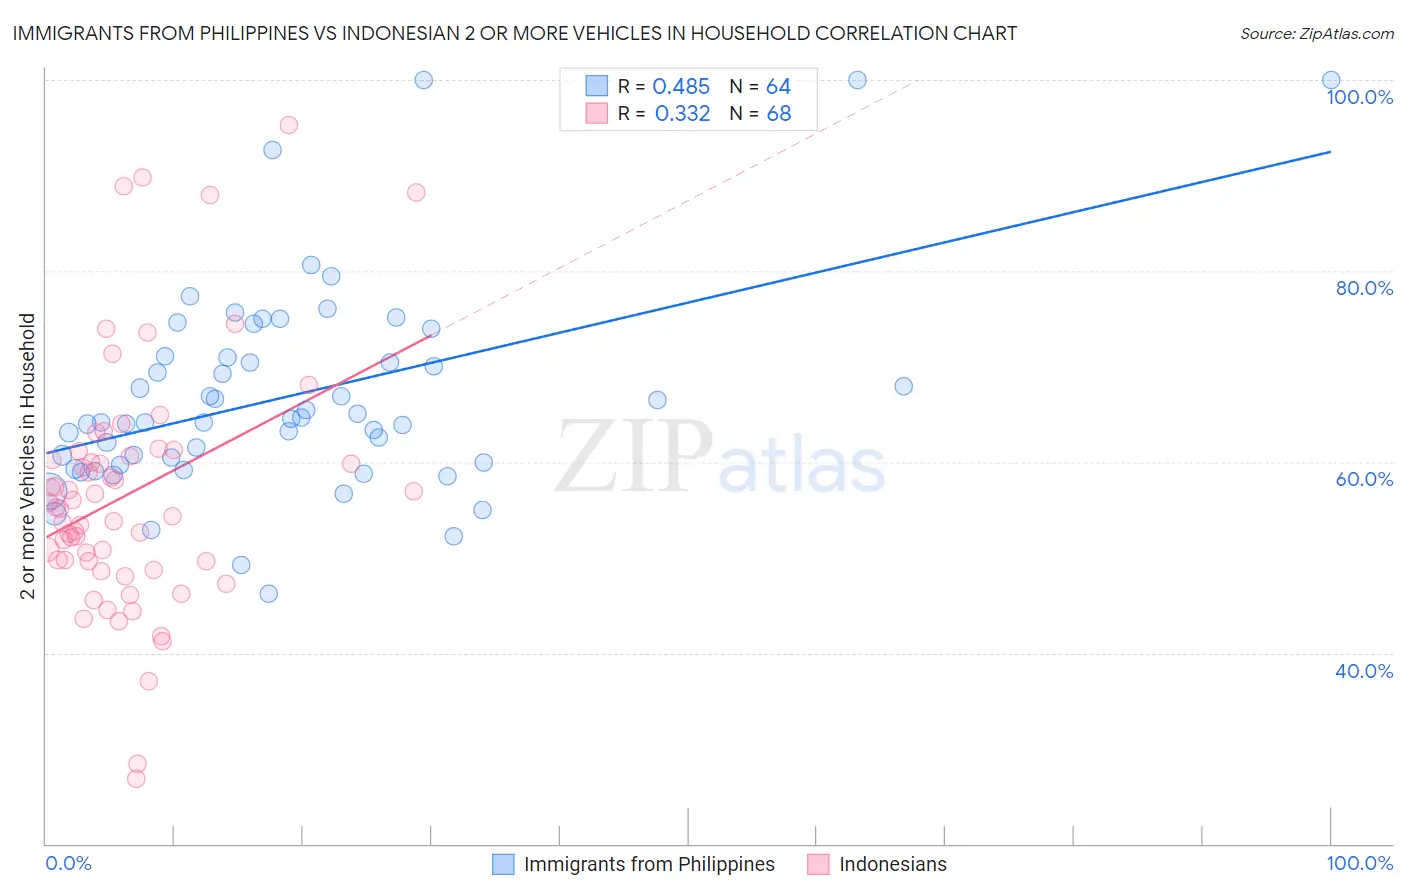
Immigrants from Philippines vs Indonesian 2 or more Vehicles in Household Correlation Chart
The statistical analysis conducted on geographies consisting of 471,056,019 people shows a moderate positive correlation between the proportion of Immigrants from Philippines and percentage of households with 2 or more vehicles available in the United States with a correlation coefficient (R) of 0.485 and weighted average of 60.1%. Similarly, the statistical analysis conducted on geographies consisting of 162,658,811 people shows a mild positive correlation between the proportion of Indonesians and percentage of households with 2 or more vehicles available in the United States with a correlation coefficient (R) of 0.332 and weighted average of 53.4%, a difference of 12.6%.
2 or more Vehicles in Household Correlation Summary
| Measurement | Immigrants from Philippines | Indonesian |
| Minimum | 46.2% | 26.8% |
| Maximum | 100.0% | 95.3% |
| Range | 53.8% | 68.6% |
| Mean | 66.9% | 56.7% |
| Median | 64.3% | 55.1% |
| Interquartile 25% (IQ1) | 59.8% | 49.6% |
| Interquartile 75% (IQ3) | 71.0% | 60.8% |
| Interquartile Range (IQR) | 11.2% | 11.2% |
| Standard Deviation (Sample) | 10.9% | 13.1% |
| Standard Deviation (Population) | 10.8% | 13.0% |
Similar Demographics by 2 or more Vehicles in Household
Demographics Similar to Immigrants from Philippines by 2 or more Vehicles in Household
In terms of 2 or more vehicles in household, the demographic groups most similar to Immigrants from Philippines are Chinese (60.1%, a difference of 0.020%), Irish (60.1%, a difference of 0.060%), Spanish (60.2%, a difference of 0.12%), American (60.0%, a difference of 0.12%), and British (60.0%, a difference of 0.12%).
| Demographics | Rating | Rank | 2 or more Vehicles in Household |
| Guamanians/Chamorros | 100.0 /100 | #28 | Exceptional 60.5% |
| Hawaiians | 100.0 /100 | #29 | Exceptional 60.4% |
| Finns | 100.0 /100 | #30 | Exceptional 60.3% |
| Spanish American Indians | 100.0 /100 | #31 | Exceptional 60.3% |
| Arapaho | 100.0 /100 | #32 | Exceptional 60.2% |
| Immigrants | Mexico | 100.0 /100 | #33 | Exceptional 60.2% |
| Spanish | 100.0 /100 | #34 | Exceptional 60.2% |
| Immigrants | Philippines | 100.0 /100 | #35 | Exceptional 60.1% |
| Chinese | 100.0 /100 | #36 | Exceptional 60.1% |
| Irish | 100.0 /100 | #37 | Exceptional 60.1% |
| Americans | 100.0 /100 | #38 | Exceptional 60.0% |
| British | 100.0 /100 | #39 | Exceptional 60.0% |
| Cherokee | 100.0 /100 | #40 | Exceptional 59.9% |
| Northern Europeans | 100.0 /100 | #41 | Exceptional 59.9% |
| Malaysians | 100.0 /100 | #42 | Exceptional 59.8% |
Demographics Similar to Indonesians by 2 or more Vehicles in Household
In terms of 2 or more vehicles in household, the demographic groups most similar to Indonesians are Immigrants from Middle Africa (53.4%, a difference of 0.10%), Macedonian (53.3%, a difference of 0.11%), Immigrants from Switzerland (53.4%, a difference of 0.13%), Ugandan (53.5%, a difference of 0.18%), and Immigrants from Armenia (53.3%, a difference of 0.18%).
| Demographics | Rating | Rank | 2 or more Vehicles in Household |
| Immigrants | Turkey | 3.8 /100 | #229 | Tragic 53.6% |
| Immigrants | Nepal | 3.6 /100 | #230 | Tragic 53.5% |
| Panamanians | 3.4 /100 | #231 | Tragic 53.5% |
| Immigrants | Guatemala | 3.2 /100 | #232 | Tragic 53.5% |
| Ugandans | 3.2 /100 | #233 | Tragic 53.5% |
| Immigrants | Switzerland | 3.0 /100 | #234 | Tragic 53.4% |
| Immigrants | Middle Africa | 3.0 /100 | #235 | Tragic 53.4% |
| Indonesians | 2.7 /100 | #236 | Tragic 53.4% |
| Macedonians | 2.4 /100 | #237 | Tragic 53.3% |
| Immigrants | Armenia | 2.3 /100 | #238 | Tragic 53.3% |
| Cambodians | 2.3 /100 | #239 | Tragic 53.3% |
| Immigrants | Europe | 2.1 /100 | #240 | Tragic 53.2% |
| Immigrants | Sierra Leone | 2.1 /100 | #241 | Tragic 53.2% |
| Immigrants | Eastern Asia | 2.1 /100 | #242 | Tragic 53.2% |
| Ethiopians | 1.7 /100 | #243 | Tragic 53.1% |