Immigrants from Afghanistan vs Indonesian 2 or more Vehicles in Household
COMPARE
Immigrants from Afghanistan
Indonesian
2 or more Vehicles in Household
2 or more Vehicles in Household Comparison
Immigrants from Afghanistan
Indonesians
58.3%
2 OR MORE VEHICLES IN HOUSEHOLD
99.6/ 100
METRIC RATING
74th/ 347
METRIC RANK
53.4%
2 OR MORE VEHICLES IN HOUSEHOLD
2.7/ 100
METRIC RATING
236th/ 347
METRIC RANK
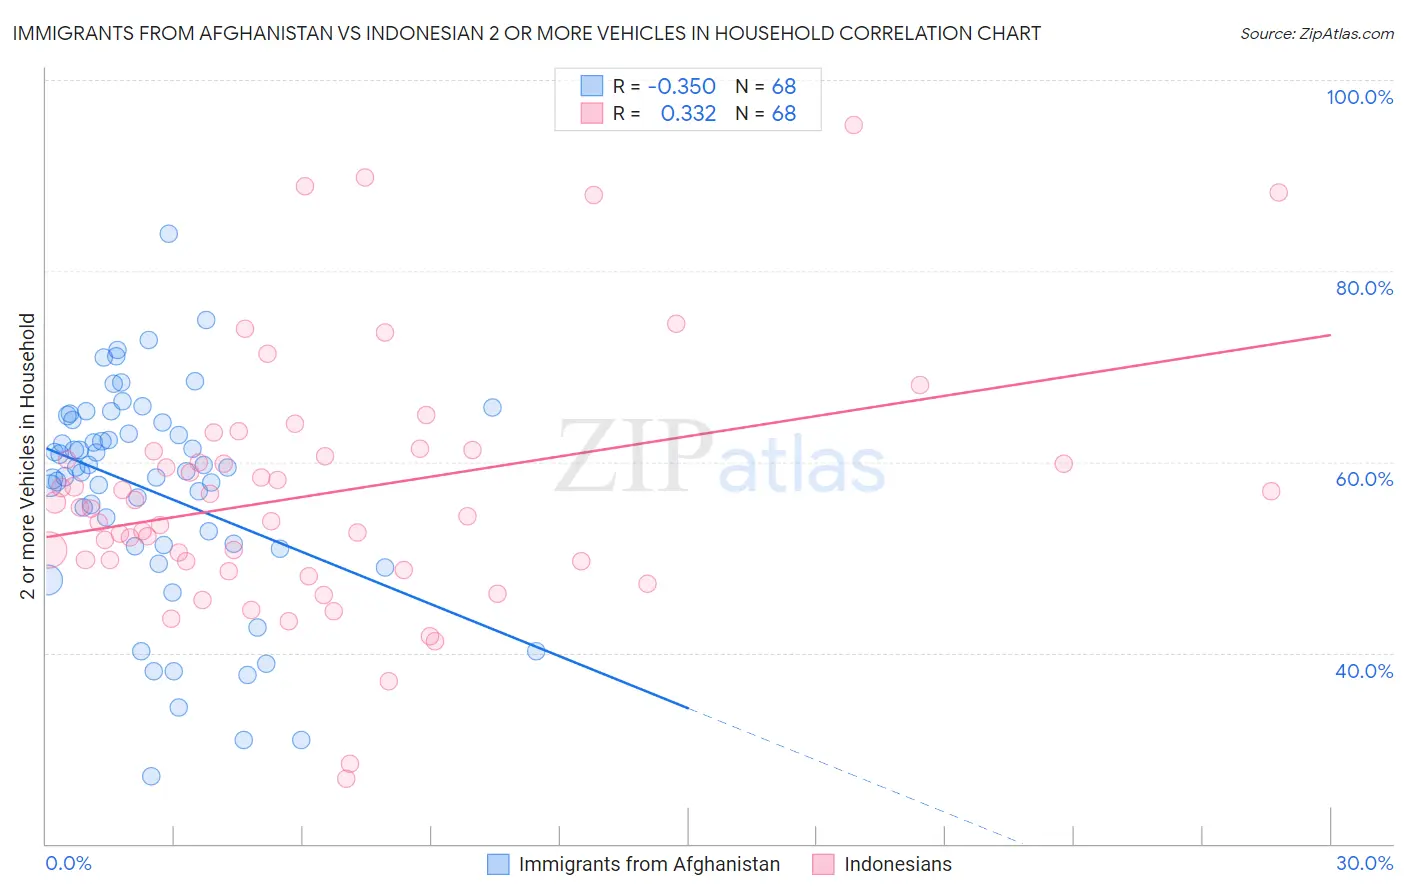
Immigrants from Afghanistan vs Indonesian 2 or more Vehicles in Household Correlation Chart
The statistical analysis conducted on geographies consisting of 147,637,495 people shows a mild negative correlation between the proportion of Immigrants from Afghanistan and percentage of households with 2 or more vehicles available in the United States with a correlation coefficient (R) of -0.350 and weighted average of 58.3%. Similarly, the statistical analysis conducted on geographies consisting of 162,658,811 people shows a mild positive correlation between the proportion of Indonesians and percentage of households with 2 or more vehicles available in the United States with a correlation coefficient (R) of 0.332 and weighted average of 53.4%, a difference of 9.3%.
2 or more Vehicles in Household Correlation Summary
| Measurement | Immigrants from Afghanistan | Indonesian |
| Minimum | 27.1% | 26.8% |
| Maximum | 83.9% | 95.3% |
| Range | 56.8% | 68.6% |
| Mean | 56.9% | 56.7% |
| Median | 59.2% | 55.1% |
| Interquartile 25% (IQ1) | 51.2% | 49.6% |
| Interquartile 75% (IQ3) | 64.3% | 60.8% |
| Interquartile Range (IQR) | 13.0% | 11.2% |
| Standard Deviation (Sample) | 11.4% | 13.1% |
| Standard Deviation (Population) | 11.3% | 13.0% |
Similar Demographics by 2 or more Vehicles in Household
Demographics Similar to Immigrants from Afghanistan by 2 or more Vehicles in Household
In terms of 2 or more vehicles in household, the demographic groups most similar to Immigrants from Afghanistan are Bolivian (58.3%, a difference of 0.0%), Polish (58.3%, a difference of 0.080%), Creek (58.3%, a difference of 0.11%), Slovene (58.3%, a difference of 0.12%), and Austrian (58.4%, a difference of 0.13%).
| Demographics | Rating | Rank | 2 or more Vehicles in Household |
| Laotians | 99.7 /100 | #67 | Exceptional 58.6% |
| Canadians | 99.7 /100 | #68 | Exceptional 58.6% |
| Pennsylvania Germans | 99.7 /100 | #69 | Exceptional 58.5% |
| Italians | 99.6 /100 | #70 | Exceptional 58.4% |
| Bangladeshis | 99.6 /100 | #71 | Exceptional 58.4% |
| Austrians | 99.6 /100 | #72 | Exceptional 58.4% |
| Bolivians | 99.6 /100 | #73 | Exceptional 58.3% |
| Immigrants | Afghanistan | 99.6 /100 | #74 | Exceptional 58.3% |
| Poles | 99.5 /100 | #75 | Exceptional 58.3% |
| Creek | 99.5 /100 | #76 | Exceptional 58.3% |
| Slovenes | 99.5 /100 | #77 | Exceptional 58.3% |
| Lithuanians | 99.5 /100 | #78 | Exceptional 58.2% |
| Delaware | 99.4 /100 | #79 | Exceptional 58.2% |
| Immigrants | England | 99.3 /100 | #80 | Exceptional 58.1% |
| Immigrants | Iraq | 99.3 /100 | #81 | Exceptional 58.1% |
Demographics Similar to Indonesians by 2 or more Vehicles in Household
In terms of 2 or more vehicles in household, the demographic groups most similar to Indonesians are Immigrants from Middle Africa (53.4%, a difference of 0.10%), Macedonian (53.3%, a difference of 0.11%), Immigrants from Switzerland (53.4%, a difference of 0.13%), Ugandan (53.5%, a difference of 0.18%), and Immigrants from Armenia (53.3%, a difference of 0.18%).
| Demographics | Rating | Rank | 2 or more Vehicles in Household |
| Immigrants | Turkey | 3.8 /100 | #229 | Tragic 53.6% |
| Immigrants | Nepal | 3.6 /100 | #230 | Tragic 53.5% |
| Panamanians | 3.4 /100 | #231 | Tragic 53.5% |
| Immigrants | Guatemala | 3.2 /100 | #232 | Tragic 53.5% |
| Ugandans | 3.2 /100 | #233 | Tragic 53.5% |
| Immigrants | Switzerland | 3.0 /100 | #234 | Tragic 53.4% |
| Immigrants | Middle Africa | 3.0 /100 | #235 | Tragic 53.4% |
| Indonesians | 2.7 /100 | #236 | Tragic 53.4% |
| Macedonians | 2.4 /100 | #237 | Tragic 53.3% |
| Immigrants | Armenia | 2.3 /100 | #238 | Tragic 53.3% |
| Cambodians | 2.3 /100 | #239 | Tragic 53.3% |
| Immigrants | Europe | 2.1 /100 | #240 | Tragic 53.2% |
| Immigrants | Sierra Leone | 2.1 /100 | #241 | Tragic 53.2% |
| Immigrants | Eastern Asia | 2.1 /100 | #242 | Tragic 53.2% |
| Ethiopians | 1.7 /100 | #243 | Tragic 53.1% |