Apache vs Indonesian 2 or more Vehicles in Household
COMPARE
Apache
Indonesian
2 or more Vehicles in Household
2 or more Vehicles in Household Comparison
Apache
Indonesians
55.1%
2 OR MORE VEHICLES IN HOUSEHOLD
36.7/ 100
METRIC RATING
184th/ 347
METRIC RANK
53.4%
2 OR MORE VEHICLES IN HOUSEHOLD
2.7/ 100
METRIC RATING
236th/ 347
METRIC RANK
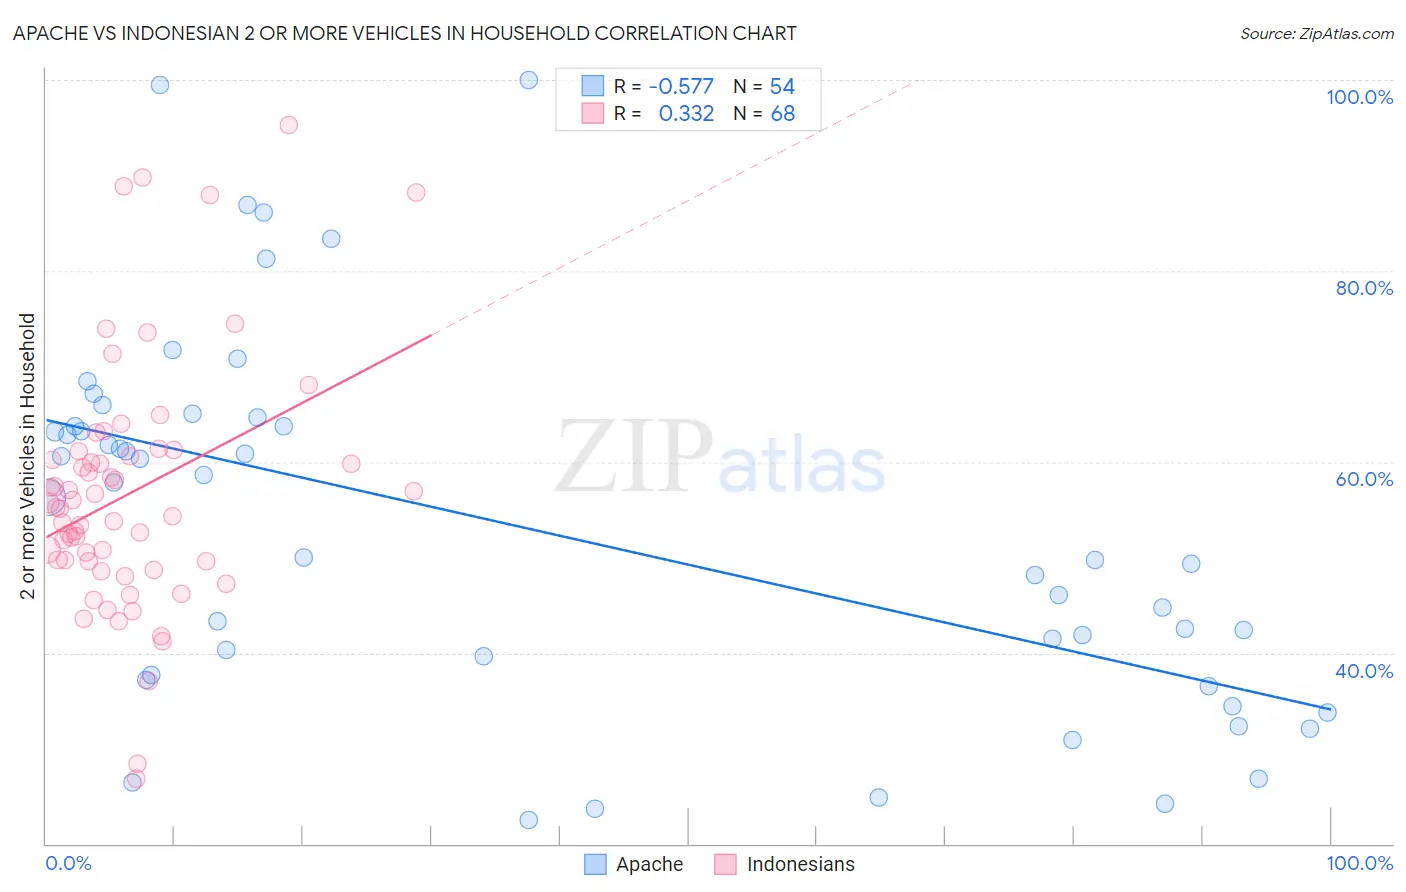
Apache vs Indonesian 2 or more Vehicles in Household Correlation Chart
The statistical analysis conducted on geographies consisting of 231,042,318 people shows a substantial negative correlation between the proportion of Apache and percentage of households with 2 or more vehicles available in the United States with a correlation coefficient (R) of -0.577 and weighted average of 55.1%. Similarly, the statistical analysis conducted on geographies consisting of 162,658,811 people shows a mild positive correlation between the proportion of Indonesians and percentage of households with 2 or more vehicles available in the United States with a correlation coefficient (R) of 0.332 and weighted average of 53.4%, a difference of 3.1%.
2 or more Vehicles in Household Correlation Summary
| Measurement | Apache | Indonesian |
| Minimum | 22.4% | 26.8% |
| Maximum | 100.0% | 95.3% |
| Range | 77.6% | 68.6% |
| Mean | 53.1% | 56.7% |
| Median | 53.1% | 55.1% |
| Interquartile 25% (IQ1) | 37.7% | 49.6% |
| Interquartile 75% (IQ3) | 63.7% | 60.8% |
| Interquartile Range (IQR) | 26.0% | 11.2% |
| Standard Deviation (Sample) | 19.2% | 13.1% |
| Standard Deviation (Population) | 19.1% | 13.0% |
Similar Demographics by 2 or more Vehicles in Household
Demographics Similar to Apache by 2 or more Vehicles in Household
In terms of 2 or more vehicles in household, the demographic groups most similar to Apache are Immigrants from Cameroon (55.1%, a difference of 0.030%), Arab (55.0%, a difference of 0.030%), Immigrants from Micronesia (55.1%, a difference of 0.060%), Cree (55.1%, a difference of 0.060%), and Peruvian (55.0%, a difference of 0.13%).
| Demographics | Rating | Rank | 2 or more Vehicles in Household |
| Menominee | 46.2 /100 | #177 | Average 55.3% |
| Immigrants | Sweden | 45.3 /100 | #178 | Average 55.2% |
| Alaskan Athabascans | 42.9 /100 | #179 | Average 55.2% |
| Immigrants | Kenya | 40.4 /100 | #180 | Average 55.1% |
| Immigrants | Micronesia | 38.2 /100 | #181 | Fair 55.1% |
| Cree | 38.2 /100 | #182 | Fair 55.1% |
| Immigrants | Cameroon | 37.3 /100 | #183 | Fair 55.1% |
| Apache | 36.7 /100 | #184 | Fair 55.1% |
| Arabs | 35.9 /100 | #185 | Fair 55.0% |
| Peruvians | 33.7 /100 | #186 | Fair 55.0% |
| Immigrants | Uganda | 33.4 /100 | #187 | Fair 55.0% |
| Marshallese | 30.5 /100 | #188 | Fair 54.9% |
| Eastern Europeans | 27.5 /100 | #189 | Fair 54.8% |
| Russians | 26.3 /100 | #190 | Fair 54.8% |
| Immigrants | Immigrants | 25.0 /100 | #191 | Fair 54.7% |
Demographics Similar to Indonesians by 2 or more Vehicles in Household
In terms of 2 or more vehicles in household, the demographic groups most similar to Indonesians are Immigrants from Middle Africa (53.4%, a difference of 0.10%), Macedonian (53.3%, a difference of 0.11%), Immigrants from Switzerland (53.4%, a difference of 0.13%), Ugandan (53.5%, a difference of 0.18%), and Immigrants from Armenia (53.3%, a difference of 0.18%).
| Demographics | Rating | Rank | 2 or more Vehicles in Household |
| Immigrants | Turkey | 3.8 /100 | #229 | Tragic 53.6% |
| Immigrants | Nepal | 3.6 /100 | #230 | Tragic 53.5% |
| Panamanians | 3.4 /100 | #231 | Tragic 53.5% |
| Immigrants | Guatemala | 3.2 /100 | #232 | Tragic 53.5% |
| Ugandans | 3.2 /100 | #233 | Tragic 53.5% |
| Immigrants | Switzerland | 3.0 /100 | #234 | Tragic 53.4% |
| Immigrants | Middle Africa | 3.0 /100 | #235 | Tragic 53.4% |
| Indonesians | 2.7 /100 | #236 | Tragic 53.4% |
| Macedonians | 2.4 /100 | #237 | Tragic 53.3% |
| Immigrants | Armenia | 2.3 /100 | #238 | Tragic 53.3% |
| Cambodians | 2.3 /100 | #239 | Tragic 53.3% |
| Immigrants | Europe | 2.1 /100 | #240 | Tragic 53.2% |
| Immigrants | Sierra Leone | 2.1 /100 | #241 | Tragic 53.2% |
| Immigrants | Eastern Asia | 2.1 /100 | #242 | Tragic 53.2% |
| Ethiopians | 1.7 /100 | #243 | Tragic 53.1% |