Immigrants from Philippines vs Immigrants from Nigeria 2 or more Vehicles in Household
COMPARE
Immigrants from Philippines
Immigrants from Nigeria
2 or more Vehicles in Household
2 or more Vehicles in Household Comparison
Immigrants from Philippines
Immigrants from Nigeria
60.1%
2 OR MORE VEHICLES IN HOUSEHOLD
100.0/ 100
METRIC RATING
35th/ 347
METRIC RANK
52.9%
2 OR MORE VEHICLES IN HOUSEHOLD
1.2/ 100
METRIC RATING
246th/ 347
METRIC RANK
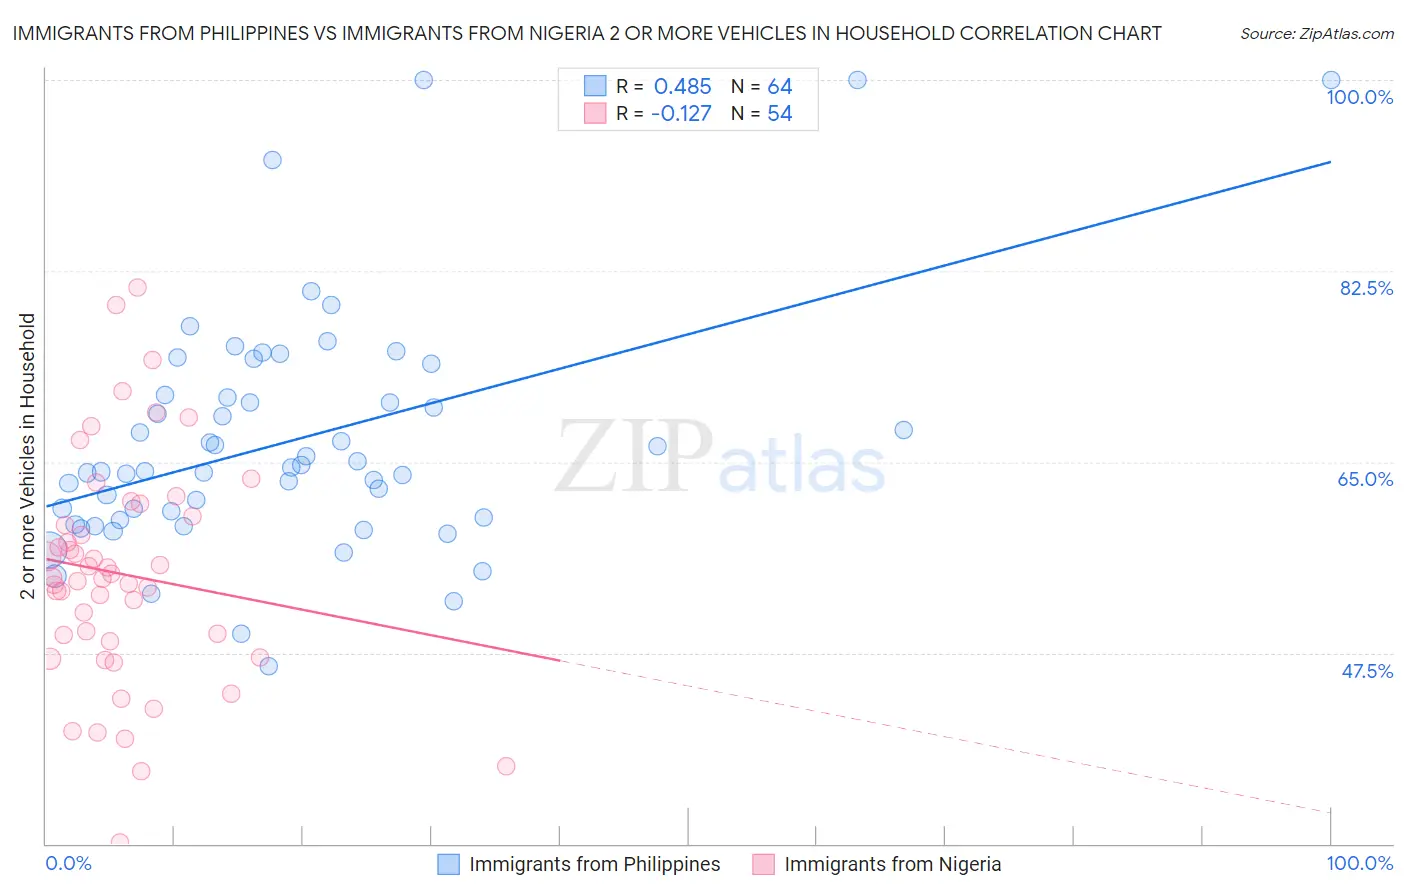
Immigrants from Philippines vs Immigrants from Nigeria 2 or more Vehicles in Household Correlation Chart
The statistical analysis conducted on geographies consisting of 471,056,019 people shows a moderate positive correlation between the proportion of Immigrants from Philippines and percentage of households with 2 or more vehicles available in the United States with a correlation coefficient (R) of 0.485 and weighted average of 60.1%. Similarly, the statistical analysis conducted on geographies consisting of 283,313,070 people shows a poor negative correlation between the proportion of Immigrants from Nigeria and percentage of households with 2 or more vehicles available in the United States with a correlation coefficient (R) of -0.127 and weighted average of 52.9%, a difference of 13.6%.
2 or more Vehicles in Household Correlation Summary
| Measurement | Immigrants from Philippines | Immigrants from Nigeria |
| Minimum | 46.2% | 30.1% |
| Maximum | 100.0% | 81.0% |
| Range | 53.8% | 50.9% |
| Mean | 66.9% | 54.7% |
| Median | 64.3% | 54.3% |
| Interquartile 25% (IQ1) | 59.8% | 48.5% |
| Interquartile 75% (IQ3) | 71.0% | 60.0% |
| Interquartile Range (IQR) | 11.2% | 11.5% |
| Standard Deviation (Sample) | 10.9% | 10.5% |
| Standard Deviation (Population) | 10.8% | 10.4% |
Similar Demographics by 2 or more Vehicles in Household
Demographics Similar to Immigrants from Philippines by 2 or more Vehicles in Household
In terms of 2 or more vehicles in household, the demographic groups most similar to Immigrants from Philippines are Chinese (60.1%, a difference of 0.020%), Irish (60.1%, a difference of 0.060%), Spanish (60.2%, a difference of 0.12%), American (60.0%, a difference of 0.12%), and British (60.0%, a difference of 0.12%).
| Demographics | Rating | Rank | 2 or more Vehicles in Household |
| Guamanians/Chamorros | 100.0 /100 | #28 | Exceptional 60.5% |
| Hawaiians | 100.0 /100 | #29 | Exceptional 60.4% |
| Finns | 100.0 /100 | #30 | Exceptional 60.3% |
| Spanish American Indians | 100.0 /100 | #31 | Exceptional 60.3% |
| Arapaho | 100.0 /100 | #32 | Exceptional 60.2% |
| Immigrants | Mexico | 100.0 /100 | #33 | Exceptional 60.2% |
| Spanish | 100.0 /100 | #34 | Exceptional 60.2% |
| Immigrants | Philippines | 100.0 /100 | #35 | Exceptional 60.1% |
| Chinese | 100.0 /100 | #36 | Exceptional 60.1% |
| Irish | 100.0 /100 | #37 | Exceptional 60.1% |
| Americans | 100.0 /100 | #38 | Exceptional 60.0% |
| British | 100.0 /100 | #39 | Exceptional 60.0% |
| Cherokee | 100.0 /100 | #40 | Exceptional 59.9% |
| Northern Europeans | 100.0 /100 | #41 | Exceptional 59.9% |
| Malaysians | 100.0 /100 | #42 | Exceptional 59.8% |
Demographics Similar to Immigrants from Nigeria by 2 or more Vehicles in Household
In terms of 2 or more vehicles in household, the demographic groups most similar to Immigrants from Nigeria are Sierra Leonean (52.9%, a difference of 0.030%), Colombian (52.9%, a difference of 0.15%), Immigrants from Ethiopia (53.0%, a difference of 0.20%), Immigrants from Brazil (52.8%, a difference of 0.20%), and Mongolian (52.8%, a difference of 0.21%).
| Demographics | Rating | Rank | 2 or more Vehicles in Household |
| Cambodians | 2.3 /100 | #239 | Tragic 53.3% |
| Immigrants | Europe | 2.1 /100 | #240 | Tragic 53.2% |
| Immigrants | Sierra Leone | 2.1 /100 | #241 | Tragic 53.2% |
| Immigrants | Eastern Asia | 2.1 /100 | #242 | Tragic 53.2% |
| Ethiopians | 1.7 /100 | #243 | Tragic 53.1% |
| Indians (Asian) | 1.7 /100 | #244 | Tragic 53.1% |
| Immigrants | Ethiopia | 1.5 /100 | #245 | Tragic 53.0% |
| Immigrants | Nigeria | 1.2 /100 | #246 | Tragic 52.9% |
| Sierra Leoneans | 1.2 /100 | #247 | Tragic 52.9% |
| Colombians | 1.1 /100 | #248 | Tragic 52.9% |
| Immigrants | Brazil | 1.0 /100 | #249 | Tragic 52.8% |
| Mongolians | 1.0 /100 | #250 | Tragic 52.8% |
| Immigrants | Sudan | 1.0 /100 | #251 | Tragic 52.8% |
| Immigrants | Portugal | 1.0 /100 | #252 | Tragic 52.8% |
| Nigerians | 0.9 /100 | #253 | Tragic 52.8% |