Creek vs Immigrants from Nigeria 2 or more Vehicles in Household
COMPARE
Creek
Immigrants from Nigeria
2 or more Vehicles in Household
2 or more Vehicles in Household Comparison
Creek
Immigrants from Nigeria
58.3%
2 OR MORE VEHICLES IN HOUSEHOLD
99.5/ 100
METRIC RATING
76th/ 347
METRIC RANK
52.9%
2 OR MORE VEHICLES IN HOUSEHOLD
1.2/ 100
METRIC RATING
246th/ 347
METRIC RANK
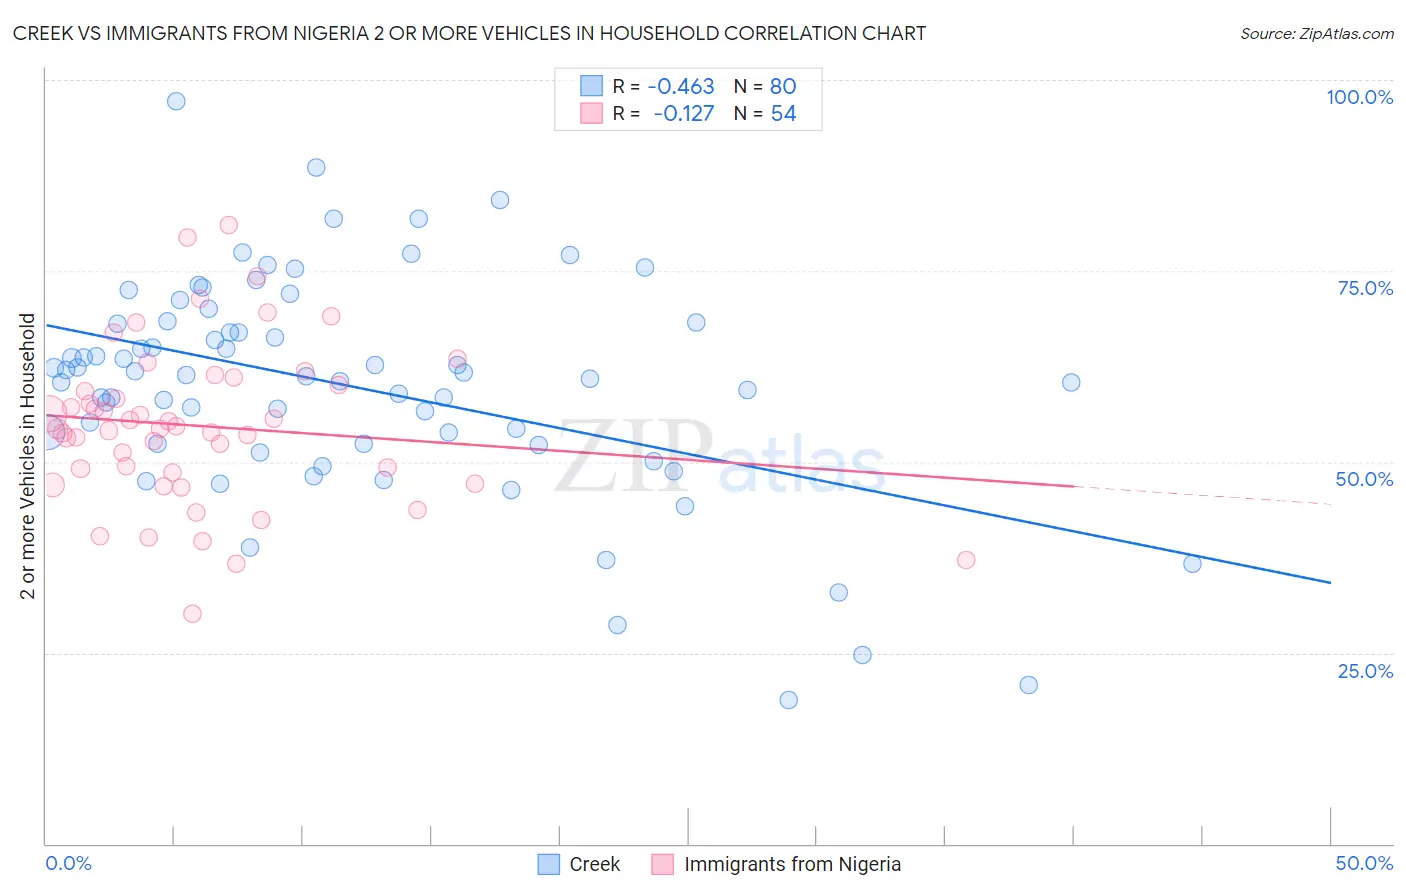
Creek vs Immigrants from Nigeria 2 or more Vehicles in Household Correlation Chart
The statistical analysis conducted on geographies consisting of 178,443,711 people shows a moderate negative correlation between the proportion of Creek and percentage of households with 2 or more vehicles available in the United States with a correlation coefficient (R) of -0.463 and weighted average of 58.3%. Similarly, the statistical analysis conducted on geographies consisting of 283,313,070 people shows a poor negative correlation between the proportion of Immigrants from Nigeria and percentage of households with 2 or more vehicles available in the United States with a correlation coefficient (R) of -0.127 and weighted average of 52.9%, a difference of 10.1%.
2 or more Vehicles in Household Correlation Summary
| Measurement | Creek | Immigrants from Nigeria |
| Minimum | 18.9% | 30.1% |
| Maximum | 97.2% | 81.0% |
| Range | 78.3% | 50.9% |
| Mean | 59.9% | 54.7% |
| Median | 61.3% | 54.3% |
| Interquartile 25% (IQ1) | 52.3% | 48.5% |
| Interquartile 75% (IQ3) | 68.2% | 60.0% |
| Interquartile Range (IQR) | 15.8% | 11.5% |
| Standard Deviation (Sample) | 14.4% | 10.5% |
| Standard Deviation (Population) | 14.4% | 10.4% |
Similar Demographics by 2 or more Vehicles in Household
Demographics Similar to Creek by 2 or more Vehicles in Household
In terms of 2 or more vehicles in household, the demographic groups most similar to Creek are Slovene (58.3%, a difference of 0.010%), Polish (58.3%, a difference of 0.030%), Lithuanian (58.2%, a difference of 0.060%), Immigrants from Afghanistan (58.3%, a difference of 0.11%), and Bolivian (58.3%, a difference of 0.12%).
| Demographics | Rating | Rank | 2 or more Vehicles in Household |
| Pennsylvania Germans | 99.7 /100 | #69 | Exceptional 58.5% |
| Italians | 99.6 /100 | #70 | Exceptional 58.4% |
| Bangladeshis | 99.6 /100 | #71 | Exceptional 58.4% |
| Austrians | 99.6 /100 | #72 | Exceptional 58.4% |
| Bolivians | 99.6 /100 | #73 | Exceptional 58.3% |
| Immigrants | Afghanistan | 99.6 /100 | #74 | Exceptional 58.3% |
| Poles | 99.5 /100 | #75 | Exceptional 58.3% |
| Creek | 99.5 /100 | #76 | Exceptional 58.3% |
| Slovenes | 99.5 /100 | #77 | Exceptional 58.3% |
| Lithuanians | 99.5 /100 | #78 | Exceptional 58.2% |
| Delaware | 99.4 /100 | #79 | Exceptional 58.2% |
| Immigrants | England | 99.3 /100 | #80 | Exceptional 58.1% |
| Immigrants | Iraq | 99.3 /100 | #81 | Exceptional 58.1% |
| Iranians | 99.3 /100 | #82 | Exceptional 58.1% |
| Icelanders | 99.2 /100 | #83 | Exceptional 58.0% |
Demographics Similar to Immigrants from Nigeria by 2 or more Vehicles in Household
In terms of 2 or more vehicles in household, the demographic groups most similar to Immigrants from Nigeria are Sierra Leonean (52.9%, a difference of 0.030%), Colombian (52.9%, a difference of 0.15%), Immigrants from Ethiopia (53.0%, a difference of 0.20%), Immigrants from Brazil (52.8%, a difference of 0.20%), and Mongolian (52.8%, a difference of 0.21%).
| Demographics | Rating | Rank | 2 or more Vehicles in Household |
| Cambodians | 2.3 /100 | #239 | Tragic 53.3% |
| Immigrants | Europe | 2.1 /100 | #240 | Tragic 53.2% |
| Immigrants | Sierra Leone | 2.1 /100 | #241 | Tragic 53.2% |
| Immigrants | Eastern Asia | 2.1 /100 | #242 | Tragic 53.2% |
| Ethiopians | 1.7 /100 | #243 | Tragic 53.1% |
| Indians (Asian) | 1.7 /100 | #244 | Tragic 53.1% |
| Immigrants | Ethiopia | 1.5 /100 | #245 | Tragic 53.0% |
| Immigrants | Nigeria | 1.2 /100 | #246 | Tragic 52.9% |
| Sierra Leoneans | 1.2 /100 | #247 | Tragic 52.9% |
| Colombians | 1.1 /100 | #248 | Tragic 52.9% |
| Immigrants | Brazil | 1.0 /100 | #249 | Tragic 52.8% |
| Mongolians | 1.0 /100 | #250 | Tragic 52.8% |
| Immigrants | Sudan | 1.0 /100 | #251 | Tragic 52.8% |
| Immigrants | Portugal | 1.0 /100 | #252 | Tragic 52.8% |
| Nigerians | 0.9 /100 | #253 | Tragic 52.8% |