Immigrants from Panama vs Ghanaian 3 or more Vehicles in Household
COMPARE
Immigrants from Panama
Ghanaian
3 or more Vehicles in Household
3 or more Vehicles in Household Comparison
Immigrants from Panama
Ghanaians
17.7%
3 OR MORE VEHICLES IN HOUSEHOLD
0.8/ 100
METRIC RATING
265th/ 347
METRIC RANK
16.4%
3 OR MORE VEHICLES IN HOUSEHOLD
0.0/ 100
METRIC RATING
304th/ 347
METRIC RANK
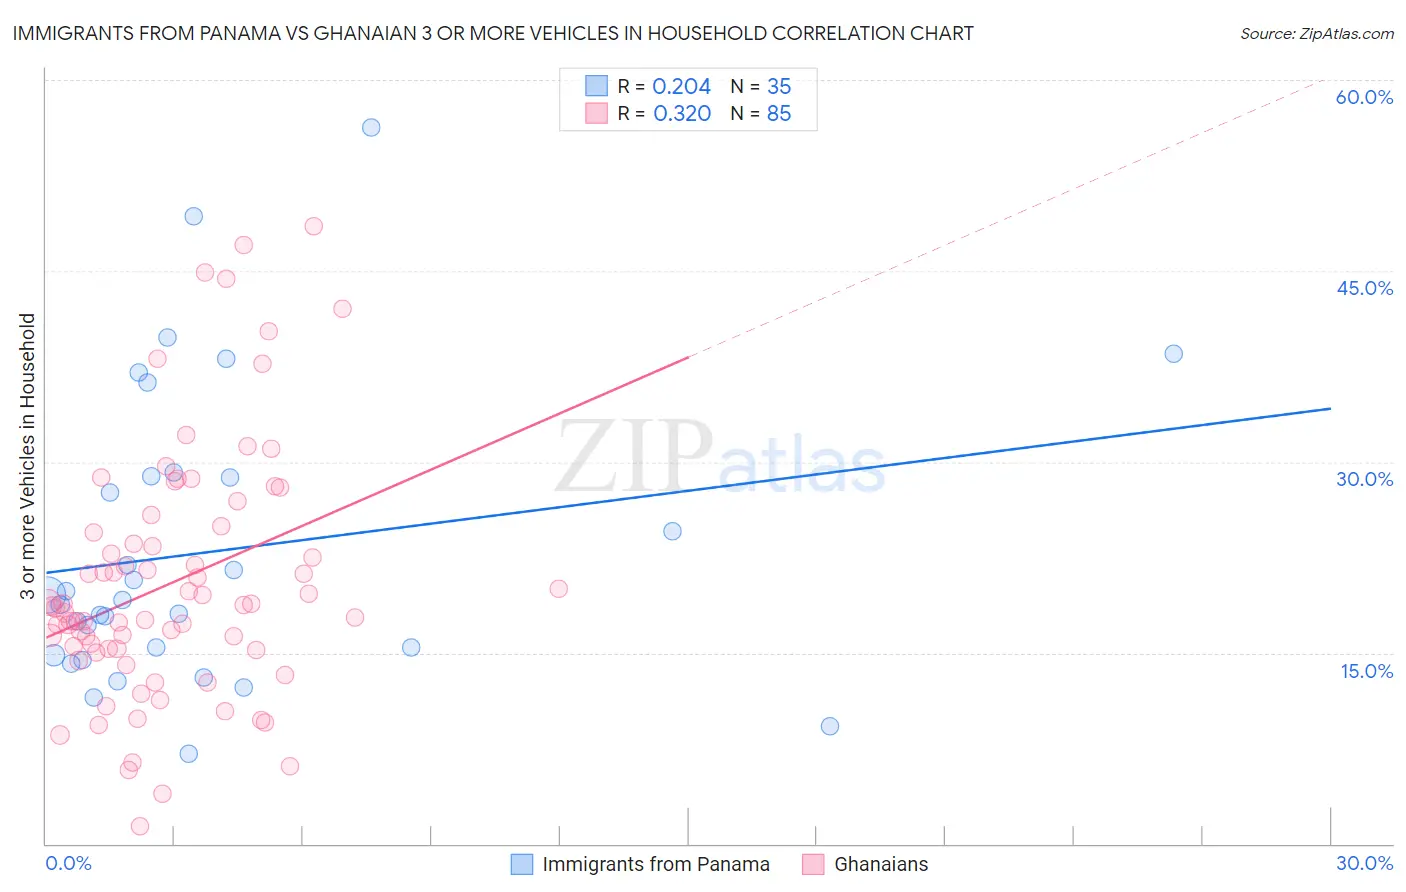
Immigrants from Panama vs Ghanaian 3 or more Vehicles in Household Correlation Chart
The statistical analysis conducted on geographies consisting of 221,149,487 people shows a weak positive correlation between the proportion of Immigrants from Panama and percentage of households with 3 or more vehicles available in the United States with a correlation coefficient (R) of 0.204 and weighted average of 17.7%. Similarly, the statistical analysis conducted on geographies consisting of 190,488,118 people shows a mild positive correlation between the proportion of Ghanaians and percentage of households with 3 or more vehicles available in the United States with a correlation coefficient (R) of 0.320 and weighted average of 16.4%, a difference of 8.4%.
3 or more Vehicles in Household Correlation Summary
| Measurement | Immigrants from Panama | Ghanaian |
| Minimum | 7.1% | 1.4% |
| Maximum | 56.2% | 48.5% |
| Range | 49.1% | 47.1% |
| Mean | 23.0% | 20.5% |
| Median | 19.1% | 18.7% |
| Interquartile 25% (IQ1) | 14.8% | 15.3% |
| Interquartile 75% (IQ3) | 28.9% | 24.7% |
| Interquartile Range (IQR) | 14.1% | 9.4% |
| Standard Deviation (Sample) | 11.5% | 9.7% |
| Standard Deviation (Population) | 11.3% | 9.7% |
Similar Demographics by 3 or more Vehicles in Household
Demographics Similar to Immigrants from Panama by 3 or more Vehicles in Household
In terms of 3 or more vehicles in household, the demographic groups most similar to Immigrants from Panama are Macedonian (17.7%, a difference of 0.020%), Immigrants from Venezuela (17.7%, a difference of 0.080%), Immigrants from Bulgaria (17.7%, a difference of 0.090%), Cambodian (17.8%, a difference of 0.14%), and Bermudan (17.8%, a difference of 0.16%).
| Demographics | Rating | Rank | 3 or more Vehicles in Household |
| Sudanese | 1.1 /100 | #258 | Tragic 17.8% |
| Uruguayans | 1.0 /100 | #259 | Tragic 17.8% |
| Ugandans | 0.9 /100 | #260 | Tragic 17.8% |
| Immigrants | Northern Africa | 0.9 /100 | #261 | Tragic 17.8% |
| Colombians | 0.9 /100 | #262 | Tragic 17.8% |
| Bermudans | 0.9 /100 | #263 | Tragic 17.8% |
| Cambodians | 0.9 /100 | #264 | Tragic 17.8% |
| Immigrants | Panama | 0.8 /100 | #265 | Tragic 17.7% |
| Macedonians | 0.8 /100 | #266 | Tragic 17.7% |
| Immigrants | Venezuela | 0.8 /100 | #267 | Tragic 17.7% |
| Immigrants | Bulgaria | 0.8 /100 | #268 | Tragic 17.7% |
| Immigrants | France | 0.6 /100 | #269 | Tragic 17.6% |
| Immigrants | Nepal | 0.6 /100 | #270 | Tragic 17.6% |
| South Americans | 0.6 /100 | #271 | Tragic 17.6% |
| Immigrants | Africa | 0.5 /100 | #272 | Tragic 17.6% |
Demographics Similar to Ghanaians by 3 or more Vehicles in Household
In terms of 3 or more vehicles in household, the demographic groups most similar to Ghanaians are Immigrants from Morocco (16.3%, a difference of 0.26%), Immigrants from Serbia (16.4%, a difference of 0.47%), Immigrants from Greece (16.5%, a difference of 0.78%), Somali (16.2%, a difference of 1.1%), and Paraguayan (16.6%, a difference of 1.2%).
| Demographics | Rating | Rank | 3 or more Vehicles in Household |
| Israelis | 0.1 /100 | #297 | Tragic 16.8% |
| Immigrants | Zaire | 0.1 /100 | #298 | Tragic 16.7% |
| Immigrants | South America | 0.1 /100 | #299 | Tragic 16.7% |
| Cypriots | 0.0 /100 | #300 | Tragic 16.6% |
| Paraguayans | 0.0 /100 | #301 | Tragic 16.6% |
| Immigrants | Greece | 0.0 /100 | #302 | Tragic 16.5% |
| Immigrants | Serbia | 0.0 /100 | #303 | Tragic 16.4% |
| Ghanaians | 0.0 /100 | #304 | Tragic 16.4% |
| Immigrants | Morocco | 0.0 /100 | #305 | Tragic 16.3% |
| Somalis | 0.0 /100 | #306 | Tragic 16.2% |
| Immigrants | Ghana | 0.0 /100 | #307 | Tragic 16.2% |
| Houma | 0.0 /100 | #308 | Tragic 16.1% |
| Immigrants | Somalia | 0.0 /100 | #309 | Tragic 15.9% |
| Moroccans | 0.0 /100 | #310 | Tragic 15.9% |
| Albanians | 0.0 /100 | #311 | Tragic 15.8% |