Spanish American Indian vs Immigrants from Belize 3 or more Vehicles in Household
COMPARE
Spanish American Indian
Immigrants from Belize
3 or more Vehicles in Household
3 or more Vehicles in Household Comparison
Spanish American Indians
Immigrants from Belize
26.9%
3 OR MORE VEHICLES IN HOUSEHOLD
100.0/ 100
METRIC RATING
2nd/ 347
METRIC RANK
18.1%
3 OR MORE VEHICLES IN HOUSEHOLD
2.1/ 100
METRIC RATING
245th/ 347
METRIC RANK
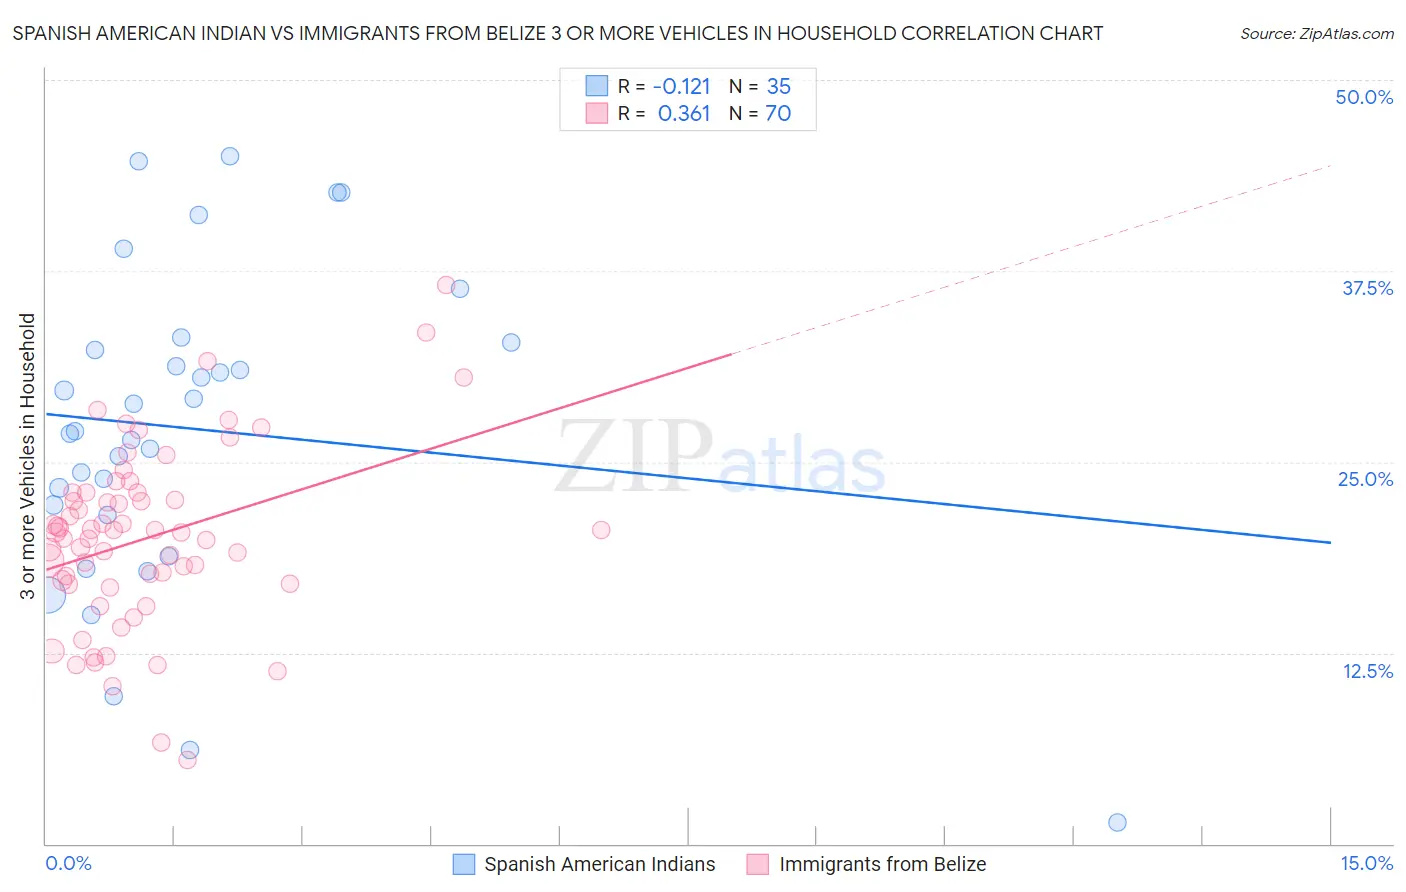
Spanish American Indian vs Immigrants from Belize 3 or more Vehicles in Household Correlation Chart
The statistical analysis conducted on geographies consisting of 73,145,550 people shows a poor negative correlation between the proportion of Spanish American Indians and percentage of households with 3 or more vehicles available in the United States with a correlation coefficient (R) of -0.121 and weighted average of 26.9%. Similarly, the statistical analysis conducted on geographies consisting of 130,289,749 people shows a mild positive correlation between the proportion of Immigrants from Belize and percentage of households with 3 or more vehicles available in the United States with a correlation coefficient (R) of 0.361 and weighted average of 18.1%, a difference of 48.9%.
3 or more Vehicles in Household Correlation Summary
| Measurement | Spanish American Indian | Immigrants from Belize |
| Minimum | 1.4% | 5.5% |
| Maximum | 45.0% | 36.6% |
| Range | 43.6% | 31.1% |
| Mean | 27.2% | 20.0% |
| Median | 27.0% | 20.4% |
| Interquartile 25% (IQ1) | 21.5% | 17.1% |
| Interquartile 75% (IQ3) | 32.8% | 23.0% |
| Interquartile Range (IQR) | 11.3% | 5.9% |
| Standard Deviation (Sample) | 10.4% | 5.8% |
| Standard Deviation (Population) | 10.3% | 5.8% |
Similar Demographics by 3 or more Vehicles in Household
Demographics Similar to Spanish American Indians by 3 or more Vehicles in Household
In terms of 3 or more vehicles in household, the demographic groups most similar to Spanish American Indians are Tongan (26.5%, a difference of 1.5%), Arapaho (26.4%, a difference of 1.8%), Puget Sound Salish (26.4%, a difference of 2.2%), Immigrants from Fiji (26.1%, a difference of 3.4%), and Colville (25.8%, a difference of 4.6%).
| Demographics | Rating | Rank | 3 or more Vehicles in Household |
| Yakama | 100.0 /100 | #1 | Exceptional 31.0% |
| Spanish American Indians | 100.0 /100 | #2 | Exceptional 26.9% |
| Tongans | 100.0 /100 | #3 | Exceptional 26.5% |
| Arapaho | 100.0 /100 | #4 | Exceptional 26.4% |
| Puget Sound Salish | 100.0 /100 | #5 | Exceptional 26.4% |
| Immigrants | Fiji | 100.0 /100 | #6 | Exceptional 26.1% |
| Colville | 100.0 /100 | #7 | Exceptional 25.8% |
| Samoans | 100.0 /100 | #8 | Exceptional 25.0% |
| Native Hawaiians | 100.0 /100 | #9 | Exceptional 24.9% |
| Nepalese | 100.0 /100 | #10 | Exceptional 24.9% |
| Shoshone | 100.0 /100 | #11 | Exceptional 24.9% |
| Danes | 100.0 /100 | #12 | Exceptional 24.7% |
| Mexicans | 100.0 /100 | #13 | Exceptional 24.7% |
| Immigrants | Mexico | 100.0 /100 | #14 | Exceptional 24.6% |
| Hawaiians | 100.0 /100 | #15 | Exceptional 24.3% |
Demographics Similar to Immigrants from Belize by 3 or more Vehicles in Household
In terms of 3 or more vehicles in household, the demographic groups most similar to Immigrants from Belize are Immigrants from Australia (18.1%, a difference of 0.070%), Mongolian (18.1%, a difference of 0.16%), Carpatho Rusyn (18.0%, a difference of 0.23%), Immigrants from Europe (18.1%, a difference of 0.28%), and Immigrants from Eastern Africa (18.0%, a difference of 0.36%).
| Demographics | Rating | Rank | 3 or more Vehicles in Household |
| Immigrants | Honduras | 3.1 /100 | #238 | Tragic 18.2% |
| Immigrants | Middle Africa | 3.1 /100 | #239 | Tragic 18.2% |
| Immigrants | China | 2.9 /100 | #240 | Tragic 18.2% |
| Africans | 2.7 /100 | #241 | Tragic 18.2% |
| Hopi | 2.5 /100 | #242 | Tragic 18.2% |
| Immigrants | Europe | 2.4 /100 | #243 | Tragic 18.1% |
| Mongolians | 2.3 /100 | #244 | Tragic 18.1% |
| Immigrants | Belize | 2.1 /100 | #245 | Tragic 18.1% |
| Immigrants | Australia | 2.0 /100 | #246 | Tragic 18.1% |
| Carpatho Rusyns | 1.9 /100 | #247 | Tragic 18.0% |
| Immigrants | Eastern Africa | 1.8 /100 | #248 | Tragic 18.0% |
| Immigrants | Saudi Arabia | 1.7 /100 | #249 | Tragic 18.0% |
| Venezuelans | 1.7 /100 | #250 | Tragic 18.0% |
| Alsatians | 1.5 /100 | #251 | Tragic 18.0% |
| Immigrants | Southern Europe | 1.4 /100 | #252 | Tragic 17.9% |