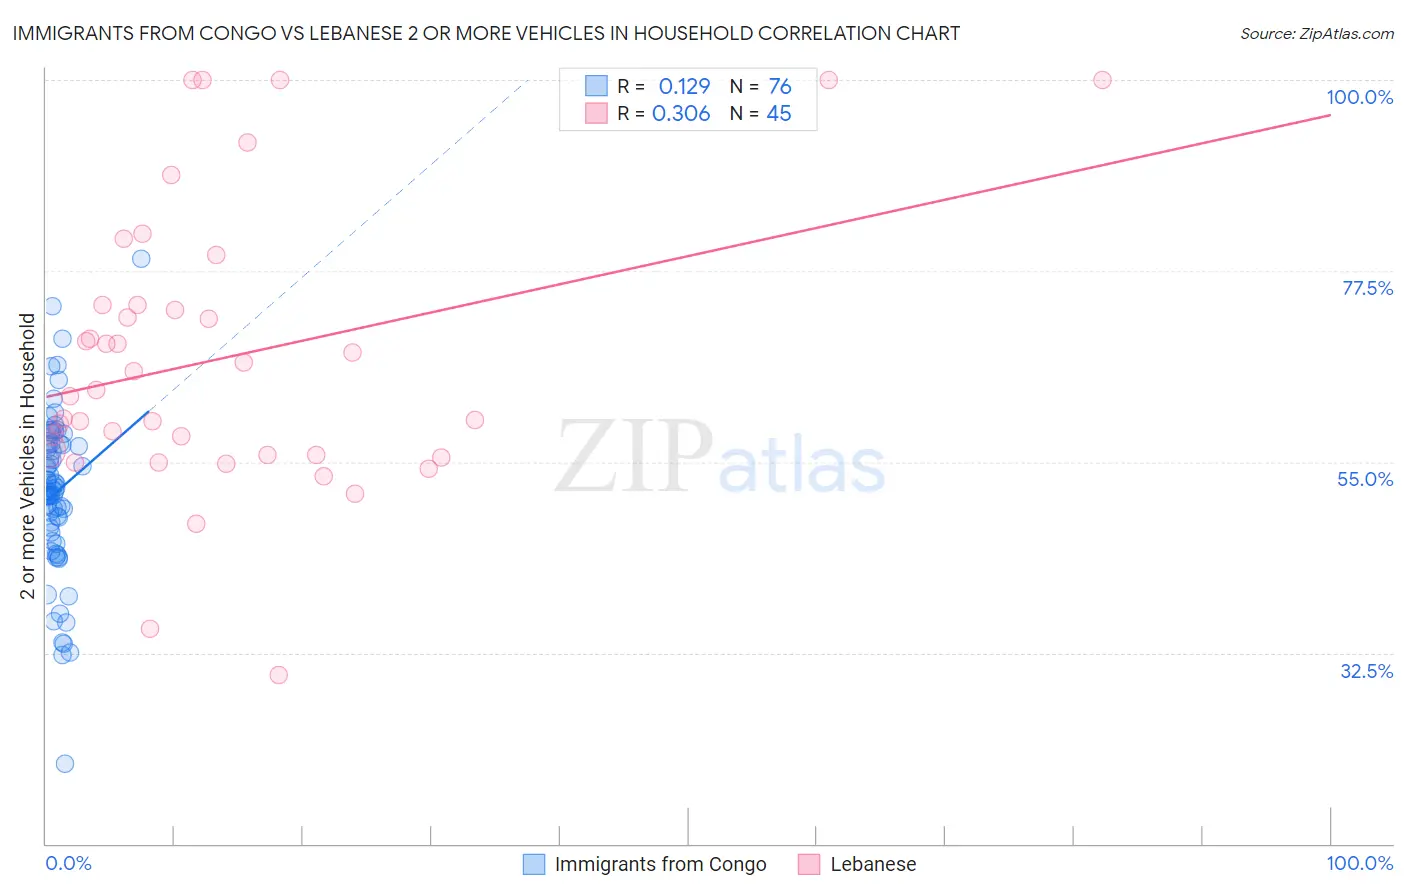
Immigrants from Congo vs Lebanese 2 or more Vehicles in Household
COMPARE
Immigrants from Congo
Lebanese
2 or more Vehicles in Household
2 or more Vehicles in Household Comparison
Immigrants from Congo
Lebanese
52.1%
2 OR MORE VEHICLES IN HOUSEHOLD
0.3/ 100
METRIC RATING
265th/ 347
METRIC RANK
57.6%
2 OR MORE VEHICLES IN HOUSEHOLD
98.3/ 100
METRIC RATING
101st/ 347
METRIC RANK
Immigrants from Congo vs Lebanese 2 or more Vehicles in Household Correlation Chart
The statistical analysis conducted on geographies consisting of 92,104,745 people shows a poor positive correlation between the proportion of Immigrants from Congo and percentage of households with 2 or more vehicles available in the United States with a correlation coefficient (R) of 0.129 and weighted average of 52.1%. Similarly, the statistical analysis conducted on geographies consisting of 401,369,606 people shows a mild positive correlation between the proportion of Lebanese and percentage of households with 2 or more vehicles available in the United States with a correlation coefficient (R) of 0.306 and weighted average of 57.6%, a difference of 10.5%.
2 or more Vehicles in Household Correlation Summary
| Measurement | Immigrants from Congo | Lebanese |
| Minimum | 19.4% | 29.8% |
| Maximum | 79.0% | 100.0% |
| Range | 59.6% | 70.2% |
| Mean | 51.4% | 67.2% |
| Median | 51.7% | 63.5% |
| Interquartile 25% (IQ1) | 47.0% | 55.8% |
| Interquartile 75% (IQ3) | 57.1% | 73.5% |
| Interquartile Range (IQR) | 10.1% | 17.8% |
| Standard Deviation (Sample) | 9.7% | 16.6% |
| Standard Deviation (Population) | 9.6% | 16.4% |
Similar Demographics by 2 or more Vehicles in Household
Demographics Similar to Immigrants from Congo by 2 or more Vehicles in Household
In terms of 2 or more vehicles in household, the demographic groups most similar to Immigrants from Congo are Immigrants from France (52.0%, a difference of 0.14%), Immigrants from Colombia (52.0%, a difference of 0.19%), Pima (52.0%, a difference of 0.20%), Honduran (52.0%, a difference of 0.20%), and Immigrants from Ireland (52.0%, a difference of 0.22%).
| Demographics | Rating | Rank | 2 or more Vehicles in Household |
| Central American Indians | 0.6 /100 | #258 | Tragic 52.5% |
| Alsatians | 0.6 /100 | #259 | Tragic 52.5% |
| Immigrants | Bahamas | 0.5 /100 | #260 | Tragic 52.5% |
| Immigrants | Australia | 0.5 /100 | #261 | Tragic 52.4% |
| Immigrants | Northern Africa | 0.4 /100 | #262 | Tragic 52.3% |
| Immigrants | Southern Europe | 0.4 /100 | #263 | Tragic 52.3% |
| Immigrants | Latvia | 0.4 /100 | #264 | Tragic 52.2% |
| Immigrants | Congo | 0.3 /100 | #265 | Tragic 52.1% |
| Immigrants | France | 0.2 /100 | #266 | Tragic 52.0% |
| Immigrants | Colombia | 0.2 /100 | #267 | Tragic 52.0% |
| Pima | 0.2 /100 | #268 | Tragic 52.0% |
| Hondurans | 0.2 /100 | #269 | Tragic 52.0% |
| Immigrants | Ireland | 0.2 /100 | #270 | Tragic 52.0% |
| South Americans | 0.2 /100 | #271 | Tragic 51.9% |
| Sub-Saharan Africans | 0.2 /100 | #272 | Tragic 51.9% |
Demographics Similar to Lebanese by 2 or more Vehicles in Household
In terms of 2 or more vehicles in household, the demographic groups most similar to Lebanese are Fijian (57.6%, a difference of 0.050%), Immigrants from Bolivia (57.6%, a difference of 0.050%), Jordanian (57.6%, a difference of 0.050%), Immigrants from Indonesia (57.6%, a difference of 0.050%), and Immigrants from Korea (57.6%, a difference of 0.050%).
| Demographics | Rating | Rank | 2 or more Vehicles in Household |
| Filipinos | 98.9 /100 | #94 | Exceptional 57.8% |
| Hmong | 98.9 /100 | #95 | Exceptional 57.8% |
| Burmese | 98.8 /100 | #96 | Exceptional 57.8% |
| Slavs | 98.8 /100 | #97 | Exceptional 57.8% |
| Palestinians | 98.6 /100 | #98 | Exceptional 57.7% |
| Cajuns | 98.5 /100 | #99 | Exceptional 57.7% |
| Fijians | 98.4 /100 | #100 | Exceptional 57.6% |
| Lebanese | 98.3 /100 | #101 | Exceptional 57.6% |
| Immigrants | Bolivia | 98.2 /100 | #102 | Exceptional 57.6% |
| Jordanians | 98.2 /100 | #103 | Exceptional 57.6% |
| Immigrants | Indonesia | 98.2 /100 | #104 | Exceptional 57.6% |
| Immigrants | Korea | 98.2 /100 | #105 | Exceptional 57.6% |
| Immigrants | Oceania | 98.2 /100 | #106 | Exceptional 57.5% |
| Immigrants | Netherlands | 98.2 /100 | #107 | Exceptional 57.5% |
| Immigrants | Canada | 98.1 /100 | #108 | Exceptional 57.5% |