Austrian vs Lebanese 2 or more Vehicles in Household
COMPARE
Austrian
Lebanese
2 or more Vehicles in Household
2 or more Vehicles in Household Comparison
Austrians
Lebanese
58.4%
2 OR MORE VEHICLES IN HOUSEHOLD
99.6/ 100
METRIC RATING
72nd/ 347
METRIC RANK
57.6%
2 OR MORE VEHICLES IN HOUSEHOLD
98.3/ 100
METRIC RATING
101st/ 347
METRIC RANK
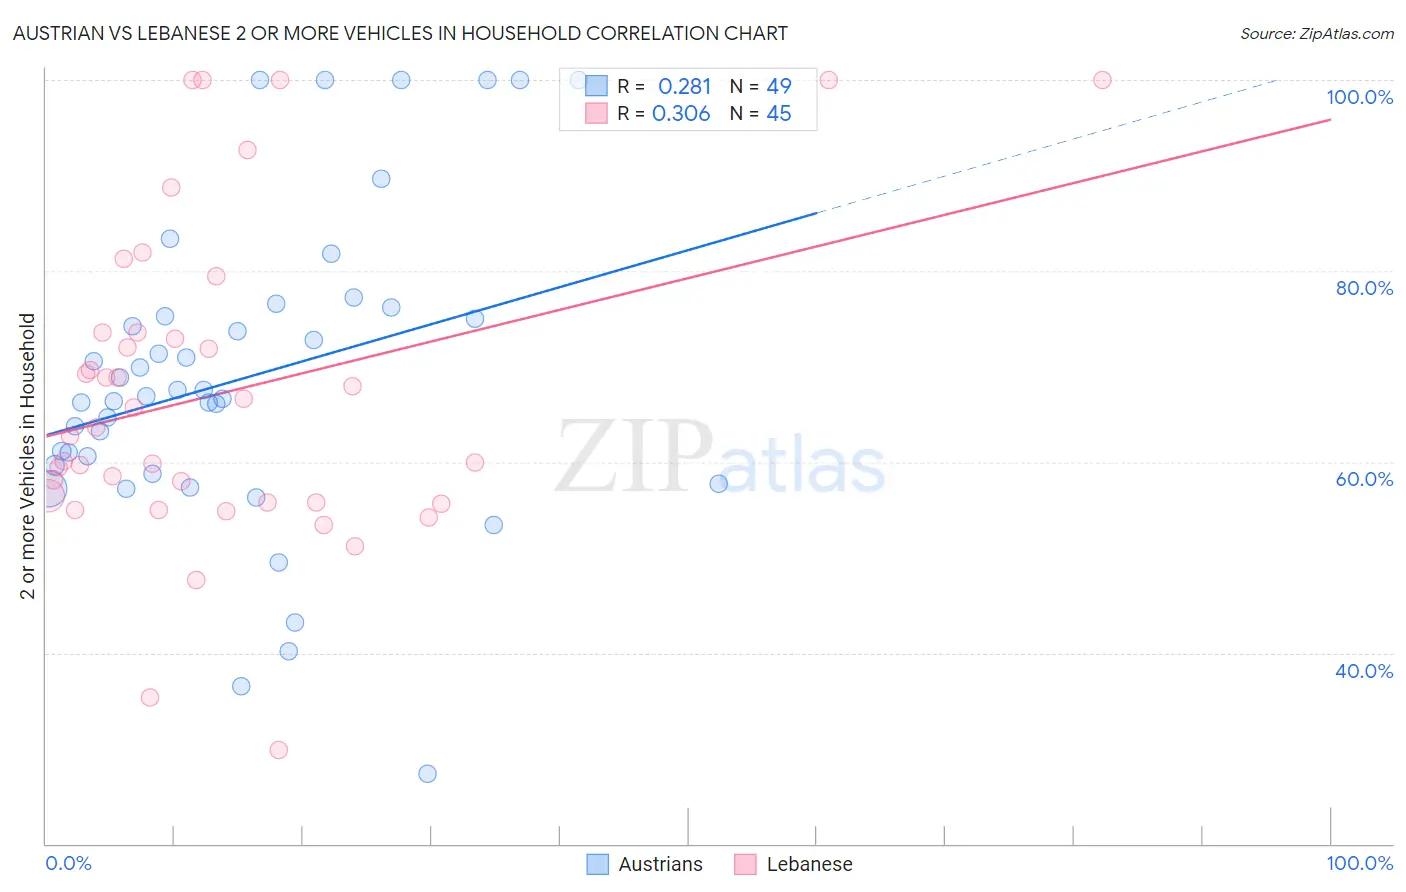
Austrian vs Lebanese 2 or more Vehicles in Household Correlation Chart
The statistical analysis conducted on geographies consisting of 451,851,074 people shows a weak positive correlation between the proportion of Austrians and percentage of households with 2 or more vehicles available in the United States with a correlation coefficient (R) of 0.281 and weighted average of 58.4%. Similarly, the statistical analysis conducted on geographies consisting of 401,369,606 people shows a mild positive correlation between the proportion of Lebanese and percentage of households with 2 or more vehicles available in the United States with a correlation coefficient (R) of 0.306 and weighted average of 57.6%, a difference of 1.4%.
2 or more Vehicles in Household Correlation Summary
| Measurement | Austrian | Lebanese |
| Minimum | 27.3% | 29.8% |
| Maximum | 100.0% | 100.0% |
| Range | 72.7% | 70.2% |
| Mean | 68.8% | 67.2% |
| Median | 66.8% | 63.5% |
| Interquartile 25% (IQ1) | 59.2% | 55.8% |
| Interquartile 75% (IQ3) | 75.7% | 73.5% |
| Interquartile Range (IQR) | 16.5% | 17.8% |
| Standard Deviation (Sample) | 16.5% | 16.6% |
| Standard Deviation (Population) | 16.3% | 16.4% |
Similar Demographics by 2 or more Vehicles in Household
Demographics Similar to Austrians by 2 or more Vehicles in Household
In terms of 2 or more vehicles in household, the demographic groups most similar to Austrians are Bangladeshi (58.4%, a difference of 0.030%), Italian (58.4%, a difference of 0.050%), Bolivian (58.3%, a difference of 0.12%), Immigrants from Afghanistan (58.3%, a difference of 0.13%), and Pennsylvania German (58.5%, a difference of 0.16%).
| Demographics | Rating | Rank | 2 or more Vehicles in Household |
| Immigrants | Central America | 99.7 /100 | #65 | Exceptional 58.6% |
| Croatians | 99.7 /100 | #66 | Exceptional 58.6% |
| Laotians | 99.7 /100 | #67 | Exceptional 58.6% |
| Canadians | 99.7 /100 | #68 | Exceptional 58.6% |
| Pennsylvania Germans | 99.7 /100 | #69 | Exceptional 58.5% |
| Italians | 99.6 /100 | #70 | Exceptional 58.4% |
| Bangladeshis | 99.6 /100 | #71 | Exceptional 58.4% |
| Austrians | 99.6 /100 | #72 | Exceptional 58.4% |
| Bolivians | 99.6 /100 | #73 | Exceptional 58.3% |
| Immigrants | Afghanistan | 99.6 /100 | #74 | Exceptional 58.3% |
| Poles | 99.5 /100 | #75 | Exceptional 58.3% |
| Creek | 99.5 /100 | #76 | Exceptional 58.3% |
| Slovenes | 99.5 /100 | #77 | Exceptional 58.3% |
| Lithuanians | 99.5 /100 | #78 | Exceptional 58.2% |
| Delaware | 99.4 /100 | #79 | Exceptional 58.2% |
Demographics Similar to Lebanese by 2 or more Vehicles in Household
In terms of 2 or more vehicles in household, the demographic groups most similar to Lebanese are Fijian (57.6%, a difference of 0.050%), Immigrants from Bolivia (57.6%, a difference of 0.050%), Jordanian (57.6%, a difference of 0.050%), Immigrants from Indonesia (57.6%, a difference of 0.050%), and Immigrants from Korea (57.6%, a difference of 0.050%).
| Demographics | Rating | Rank | 2 or more Vehicles in Household |
| Filipinos | 98.9 /100 | #94 | Exceptional 57.8% |
| Hmong | 98.9 /100 | #95 | Exceptional 57.8% |
| Burmese | 98.8 /100 | #96 | Exceptional 57.8% |
| Slavs | 98.8 /100 | #97 | Exceptional 57.8% |
| Palestinians | 98.6 /100 | #98 | Exceptional 57.7% |
| Cajuns | 98.5 /100 | #99 | Exceptional 57.7% |
| Fijians | 98.4 /100 | #100 | Exceptional 57.6% |
| Lebanese | 98.3 /100 | #101 | Exceptional 57.6% |
| Immigrants | Bolivia | 98.2 /100 | #102 | Exceptional 57.6% |
| Jordanians | 98.2 /100 | #103 | Exceptional 57.6% |
| Immigrants | Indonesia | 98.2 /100 | #104 | Exceptional 57.6% |
| Immigrants | Korea | 98.2 /100 | #105 | Exceptional 57.6% |
| Immigrants | Oceania | 98.2 /100 | #106 | Exceptional 57.5% |
| Immigrants | Netherlands | 98.2 /100 | #107 | Exceptional 57.5% |
| Immigrants | Canada | 98.1 /100 | #108 | Exceptional 57.5% |