Immigrants from Nigeria vs Lebanese Currently Married
COMPARE
Immigrants from Nigeria
Lebanese
Currently Married
Currently Married Comparison
Immigrants from Nigeria
Lebanese
43.4%
CURRENTLY MARRIED
0.1/ 100
METRIC RATING
277th/ 347
METRIC RANK
47.9%
CURRENTLY MARRIED
95.1/ 100
METRIC RATING
93rd/ 347
METRIC RANK
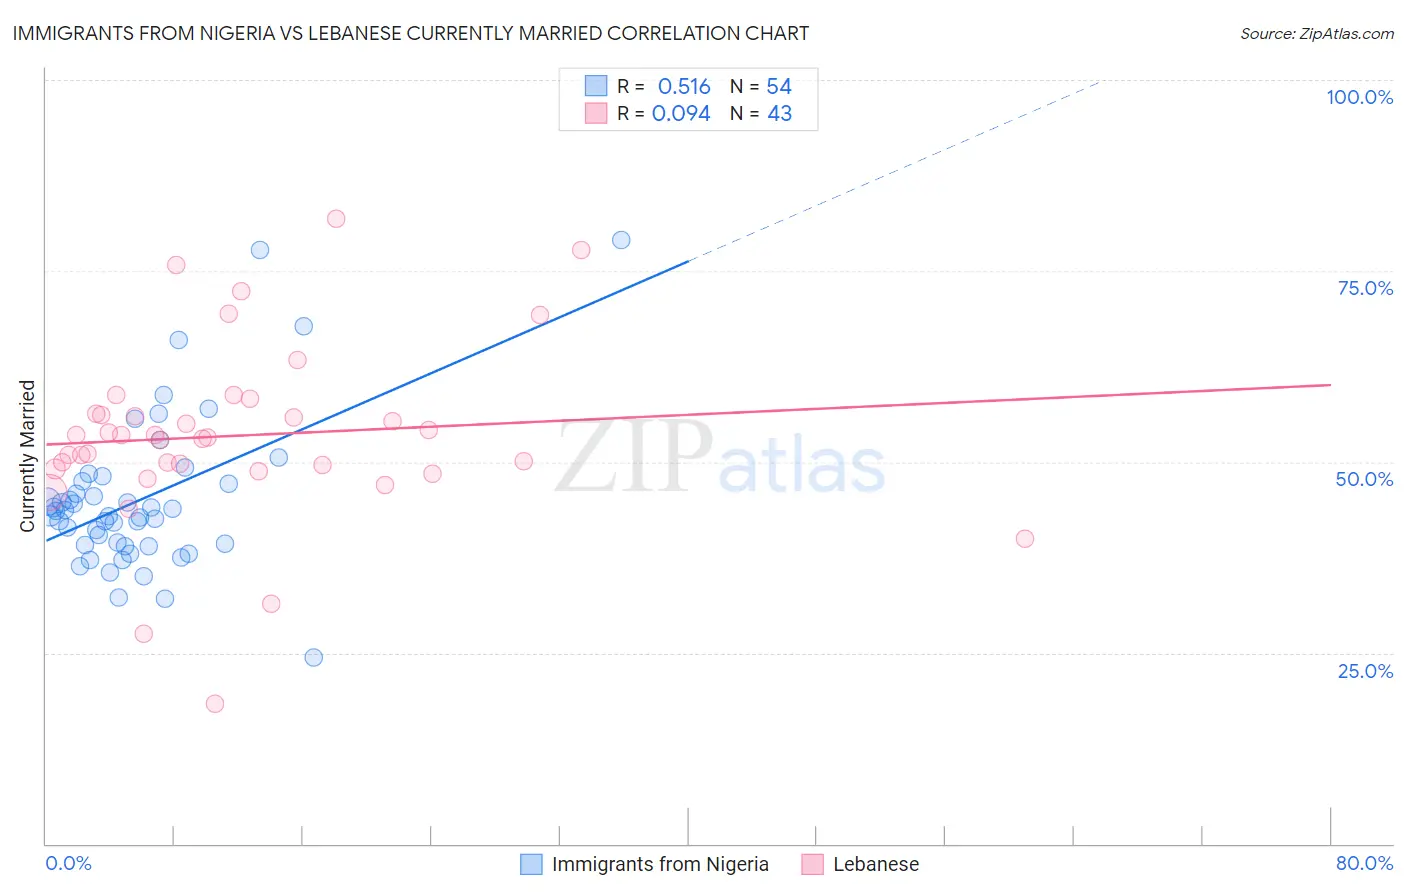
Immigrants from Nigeria vs Lebanese Currently Married Correlation Chart
The statistical analysis conducted on geographies consisting of 283,441,157 people shows a substantial positive correlation between the proportion of Immigrants from Nigeria and percentage of population currently married in the United States with a correlation coefficient (R) of 0.516 and weighted average of 43.4%. Similarly, the statistical analysis conducted on geographies consisting of 401,555,158 people shows a slight positive correlation between the proportion of Lebanese and percentage of population currently married in the United States with a correlation coefficient (R) of 0.094 and weighted average of 47.9%, a difference of 10.3%.
Currently Married Correlation Summary
| Measurement | Immigrants from Nigeria | Lebanese |
| Minimum | 24.4% | 18.3% |
| Maximum | 79.1% | 81.9% |
| Range | 54.7% | 63.6% |
| Mean | 45.1% | 53.4% |
| Median | 43.2% | 53.2% |
| Interquartile 25% (IQ1) | 39.2% | 49.1% |
| Interquartile 75% (IQ3) | 47.4% | 56.3% |
| Interquartile Range (IQR) | 8.3% | 7.3% |
| Standard Deviation (Sample) | 10.2% | 11.9% |
| Standard Deviation (Population) | 10.1% | 11.7% |
Similar Demographics by Currently Married
Demographics Similar to Immigrants from Nigeria by Currently Married
In terms of currently married, the demographic groups most similar to Immigrants from Nigeria are Sierra Leonean (43.4%, a difference of 0.010%), Colville (43.4%, a difference of 0.040%), Nigerian (43.4%, a difference of 0.060%), Yaqui (43.4%, a difference of 0.070%), and Indonesian (43.5%, a difference of 0.12%).
| Demographics | Rating | Rank | Currently Married |
| Salvadorans | 0.1 /100 | #270 | Tragic 43.5% |
| Bermudans | 0.1 /100 | #271 | Tragic 43.5% |
| Indonesians | 0.1 /100 | #272 | Tragic 43.5% |
| Yaqui | 0.1 /100 | #273 | Tragic 43.4% |
| Nigerians | 0.1 /100 | #274 | Tragic 43.4% |
| Colville | 0.1 /100 | #275 | Tragic 43.4% |
| Sierra Leoneans | 0.1 /100 | #276 | Tragic 43.4% |
| Immigrants | Nigeria | 0.1 /100 | #277 | Tragic 43.4% |
| Central Americans | 0.0 /100 | #278 | Tragic 43.3% |
| Central American Indians | 0.0 /100 | #279 | Tragic 43.3% |
| Apache | 0.0 /100 | #280 | Tragic 43.2% |
| Chippewa | 0.0 /100 | #281 | Tragic 43.2% |
| Immigrants | Ecuador | 0.0 /100 | #282 | Tragic 43.2% |
| Kiowa | 0.0 /100 | #283 | Tragic 43.2% |
| Immigrants | El Salvador | 0.0 /100 | #284 | Tragic 43.1% |
Demographics Similar to Lebanese by Currently Married
In terms of currently married, the demographic groups most similar to Lebanese are Native Hawaiian (47.9%, a difference of 0.010%), Korean (47.9%, a difference of 0.050%), Immigrants from Bulgaria (47.9%, a difference of 0.050%), Egyptian (47.9%, a difference of 0.050%), and Immigrants from Ukraine (47.9%, a difference of 0.060%).
| Demographics | Rating | Rank | Currently Married |
| Immigrants | Japan | 96.2 /100 | #86 | Exceptional 48.0% |
| Jordanians | 96.2 /100 | #87 | Exceptional 48.0% |
| Immigrants | Eastern Europe | 96.1 /100 | #88 | Exceptional 48.0% |
| Indians (Asian) | 95.8 /100 | #89 | Exceptional 48.0% |
| Americans | 95.7 /100 | #90 | Exceptional 48.0% |
| Immigrants | Bolivia | 95.6 /100 | #91 | Exceptional 47.9% |
| Koreans | 95.4 /100 | #92 | Exceptional 47.9% |
| Lebanese | 95.1 /100 | #93 | Exceptional 47.9% |
| Native Hawaiians | 95.0 /100 | #94 | Exceptional 47.9% |
| Immigrants | Bulgaria | 94.8 /100 | #95 | Exceptional 47.9% |
| Egyptians | 94.8 /100 | #96 | Exceptional 47.9% |
| Immigrants | Ukraine | 94.8 /100 | #97 | Exceptional 47.9% |
| Immigrants | China | 94.7 /100 | #98 | Exceptional 47.9% |
| Immigrants | Sweden | 94.3 /100 | #99 | Exceptional 47.8% |
| Celtics | 94.2 /100 | #100 | Exceptional 47.8% |