Immigrants from Nicaragua vs Immigrants from Haiti 3 or more Vehicles in Household
COMPARE
Immigrants from Nicaragua
Immigrants from Haiti
3 or more Vehicles in Household
3 or more Vehicles in Household Comparison
Immigrants from Nicaragua
Immigrants from Haiti
20.2%
3 OR MORE VEHICLES IN HOUSEHOLD
87.1/ 100
METRIC RATING
136th/ 347
METRIC RANK
15.2%
3 OR MORE VEHICLES IN HOUSEHOLD
0.0/ 100
METRIC RATING
318th/ 347
METRIC RANK
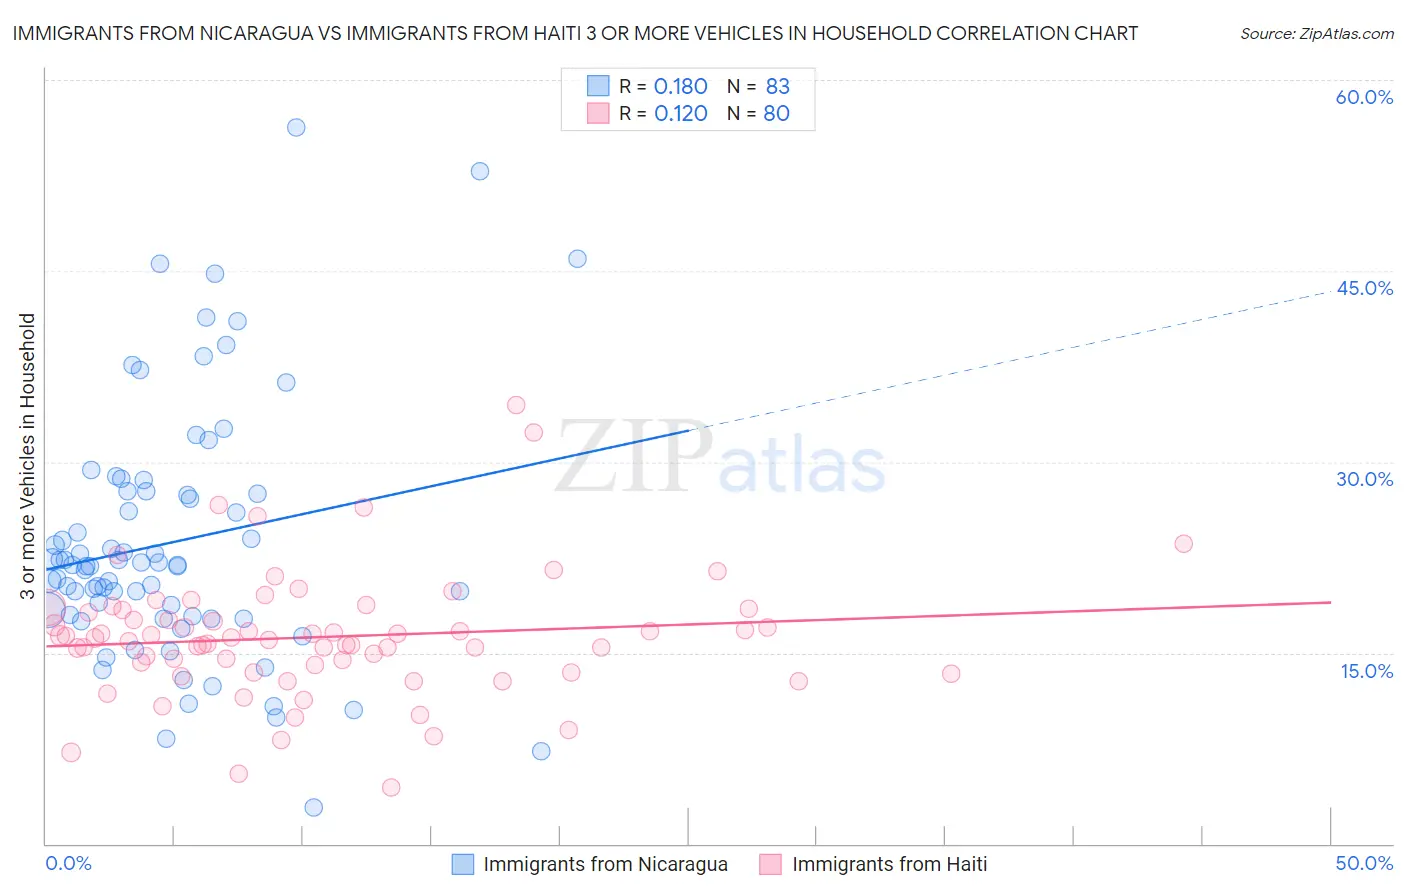
Immigrants from Nicaragua vs Immigrants from Haiti 3 or more Vehicles in Household Correlation Chart
The statistical analysis conducted on geographies consisting of 236,311,792 people shows a poor positive correlation between the proportion of Immigrants from Nicaragua and percentage of households with 3 or more vehicles available in the United States with a correlation coefficient (R) of 0.180 and weighted average of 20.2%. Similarly, the statistical analysis conducted on geographies consisting of 225,114,501 people shows a poor positive correlation between the proportion of Immigrants from Haiti and percentage of households with 3 or more vehicles available in the United States with a correlation coefficient (R) of 0.120 and weighted average of 15.2%, a difference of 33.1%.
3 or more Vehicles in Household Correlation Summary
| Measurement | Immigrants from Nicaragua | Immigrants from Haiti |
| Minimum | 2.8% | 4.5% |
| Maximum | 56.2% | 34.5% |
| Range | 53.4% | 30.0% |
| Mean | 23.7% | 16.2% |
| Median | 21.9% | 16.1% |
| Interquartile 25% (IQ1) | 17.9% | 13.8% |
| Interquartile 75% (IQ3) | 27.6% | 18.3% |
| Interquartile Range (IQR) | 9.8% | 4.5% |
| Standard Deviation (Sample) | 10.0% | 5.0% |
| Standard Deviation (Population) | 9.9% | 4.9% |
Similar Demographics by 3 or more Vehicles in Household
Demographics Similar to Immigrants from Nicaragua by 3 or more Vehicles in Household
In terms of 3 or more vehicles in household, the demographic groups most similar to Immigrants from Nicaragua are Immigrants from Iraq (20.2%, a difference of 0.0%), Immigrants from India (20.2%, a difference of 0.010%), Polish (20.2%, a difference of 0.030%), Immigrants from Canada (20.2%, a difference of 0.12%), and Immigrants from North America (20.2%, a difference of 0.12%).
| Demographics | Rating | Rank | 3 or more Vehicles in Household |
| Zimbabweans | 88.7 /100 | #129 | Excellent 20.3% |
| Greeks | 88.6 /100 | #130 | Excellent 20.3% |
| Immigrants | Asia | 88.1 /100 | #131 | Excellent 20.2% |
| Immigrants | Canada | 87.8 /100 | #132 | Excellent 20.2% |
| Immigrants | North America | 87.8 /100 | #133 | Excellent 20.2% |
| Poles | 87.3 /100 | #134 | Excellent 20.2% |
| Immigrants | India | 87.2 /100 | #135 | Excellent 20.2% |
| Immigrants | Nicaragua | 87.1 /100 | #136 | Excellent 20.2% |
| Immigrants | Iraq | 87.1 /100 | #137 | Excellent 20.2% |
| Aleuts | 86.3 /100 | #138 | Excellent 20.2% |
| Slovenes | 85.5 /100 | #139 | Excellent 20.2% |
| French American Indians | 85.3 /100 | #140 | Excellent 20.1% |
| Ottawa | 84.9 /100 | #141 | Excellent 20.1% |
| Jordanians | 84.4 /100 | #142 | Excellent 20.1% |
| Lithuanians | 84.4 /100 | #143 | Excellent 20.1% |
Demographics Similar to Immigrants from Haiti by 3 or more Vehicles in Household
In terms of 3 or more vehicles in household, the demographic groups most similar to Immigrants from Haiti are Jamaican (15.2%, a difference of 0.20%), Cape Verdean (15.0%, a difference of 1.2%), U.S. Virgin Islander (15.4%, a difference of 1.4%), Haitian (15.5%, a difference of 1.9%), and Immigrants from Belarus (15.5%, a difference of 2.2%).
| Demographics | Rating | Rank | 3 or more Vehicles in Household |
| Albanians | 0.0 /100 | #311 | Tragic 15.8% |
| Puerto Ricans | 0.0 /100 | #312 | Tragic 15.6% |
| Immigrants | Israel | 0.0 /100 | #313 | Tragic 15.6% |
| Immigrants | Belarus | 0.0 /100 | #314 | Tragic 15.5% |
| Haitians | 0.0 /100 | #315 | Tragic 15.5% |
| U.S. Virgin Islanders | 0.0 /100 | #316 | Tragic 15.4% |
| Jamaicans | 0.0 /100 | #317 | Tragic 15.2% |
| Immigrants | Haiti | 0.0 /100 | #318 | Tragic 15.2% |
| Cape Verdeans | 0.0 /100 | #319 | Tragic 15.0% |
| Yup'ik | 0.0 /100 | #320 | Tragic 14.8% |
| Immigrants | Jamaica | 0.0 /100 | #321 | Tragic 14.7% |
| Immigrants | West Indies | 0.0 /100 | #322 | Tragic 14.6% |
| Immigrants | Caribbean | 0.0 /100 | #323 | Tragic 14.6% |
| Immigrants | Yemen | 0.0 /100 | #324 | Tragic 14.2% |
| Senegalese | 0.0 /100 | #325 | Tragic 14.2% |