Immigrants from Nepal vs American 3 or more Vehicles in Household
COMPARE
Immigrants from Nepal
American
3 or more Vehicles in Household
3 or more Vehicles in Household Comparison
Immigrants from Nepal
Americans
17.6%
3 OR MORE VEHICLES IN HOUSEHOLD
0.6/ 100
METRIC RATING
270th/ 347
METRIC RANK
22.6%
3 OR MORE VEHICLES IN HOUSEHOLD
100.0/ 100
METRIC RATING
46th/ 347
METRIC RANK
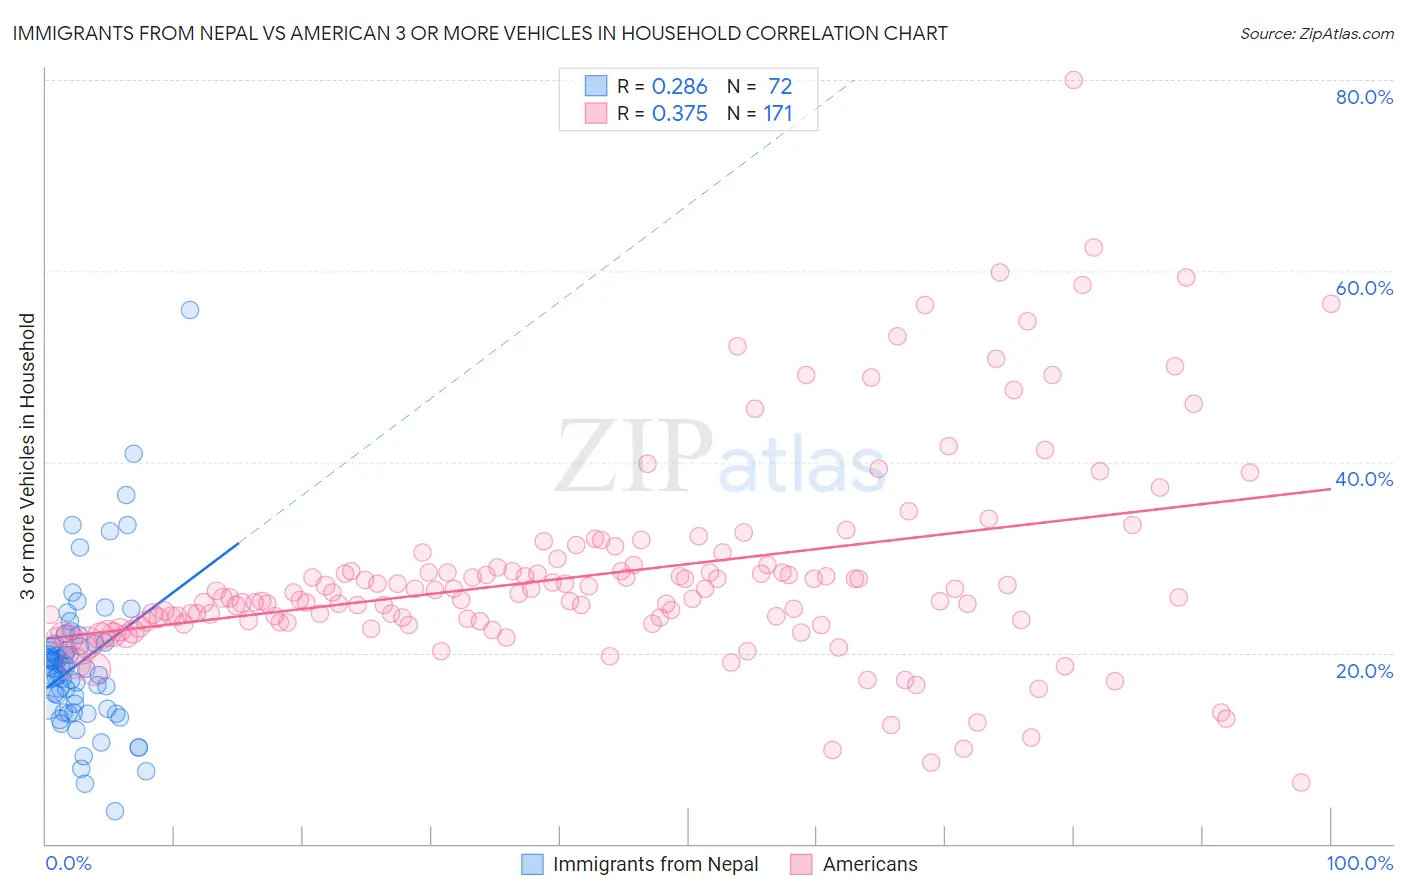
Immigrants from Nepal vs American 3 or more Vehicles in Household Correlation Chart
The statistical analysis conducted on geographies consisting of 186,663,227 people shows a weak positive correlation between the proportion of Immigrants from Nepal and percentage of households with 3 or more vehicles available in the United States with a correlation coefficient (R) of 0.286 and weighted average of 17.6%. Similarly, the statistical analysis conducted on geographies consisting of 581,030,597 people shows a mild positive correlation between the proportion of Americans and percentage of households with 3 or more vehicles available in the United States with a correlation coefficient (R) of 0.375 and weighted average of 22.6%, a difference of 28.3%.
3 or more Vehicles in Household Correlation Summary
| Measurement | Immigrants from Nepal | American |
| Minimum | 3.4% | 6.4% |
| Maximum | 55.9% | 80.0% |
| Range | 52.5% | 73.6% |
| Mean | 19.0% | 28.3% |
| Median | 18.3% | 25.8% |
| Interquartile 25% (IQ1) | 14.2% | 23.2% |
| Interquartile 75% (IQ3) | 21.0% | 29.0% |
| Interquartile Range (IQR) | 6.8% | 5.8% |
| Standard Deviation (Sample) | 8.0% | 10.9% |
| Standard Deviation (Population) | 8.0% | 10.9% |
Similar Demographics by 3 or more Vehicles in Household
Demographics Similar to Immigrants from Nepal by 3 or more Vehicles in Household
In terms of 3 or more vehicles in household, the demographic groups most similar to Immigrants from Nepal are South American (17.6%, a difference of 0.0%), Immigrants from France (17.6%, a difference of 0.050%), Immigrants from Africa (17.6%, a difference of 0.41%), Immigrants from Sudan (17.6%, a difference of 0.45%), and Immigrants from Bulgaria (17.7%, a difference of 0.47%).
| Demographics | Rating | Rank | 3 or more Vehicles in Household |
| Bermudans | 0.9 /100 | #263 | Tragic 17.8% |
| Cambodians | 0.9 /100 | #264 | Tragic 17.8% |
| Immigrants | Panama | 0.8 /100 | #265 | Tragic 17.7% |
| Macedonians | 0.8 /100 | #266 | Tragic 17.7% |
| Immigrants | Venezuela | 0.8 /100 | #267 | Tragic 17.7% |
| Immigrants | Bulgaria | 0.8 /100 | #268 | Tragic 17.7% |
| Immigrants | France | 0.6 /100 | #269 | Tragic 17.6% |
| Immigrants | Nepal | 0.6 /100 | #270 | Tragic 17.6% |
| South Americans | 0.6 /100 | #271 | Tragic 17.6% |
| Immigrants | Africa | 0.5 /100 | #272 | Tragic 17.6% |
| Immigrants | Sudan | 0.5 /100 | #273 | Tragic 17.6% |
| Immigrants | Bosnia and Herzegovina | 0.5 /100 | #274 | Tragic 17.5% |
| Immigrants | Ukraine | 0.4 /100 | #275 | Tragic 17.5% |
| Okinawans | 0.4 /100 | #276 | Tragic 17.4% |
| Brazilians | 0.4 /100 | #277 | Tragic 17.4% |
Demographics Similar to Americans by 3 or more Vehicles in Household
In terms of 3 or more vehicles in household, the demographic groups most similar to Americans are Malaysian (22.6%, a difference of 0.010%), Scottish (22.6%, a difference of 0.020%), Scotch-Irish (22.6%, a difference of 0.12%), Sioux (22.6%, a difference of 0.18%), and Ute (22.7%, a difference of 0.19%).
| Demographics | Rating | Rank | 3 or more Vehicles in Household |
| Yaqui | 100.0 /100 | #39 | Exceptional 22.9% |
| Europeans | 100.0 /100 | #40 | Exceptional 22.9% |
| Germans | 100.0 /100 | #41 | Exceptional 22.7% |
| Natives/Alaskans | 100.0 /100 | #42 | Exceptional 22.7% |
| Osage | 100.0 /100 | #43 | Exceptional 22.7% |
| Cheyenne | 100.0 /100 | #44 | Exceptional 22.7% |
| Ute | 100.0 /100 | #45 | Exceptional 22.7% |
| Americans | 100.0 /100 | #46 | Exceptional 22.6% |
| Malaysians | 100.0 /100 | #47 | Exceptional 22.6% |
| Scottish | 100.0 /100 | #48 | Exceptional 22.6% |
| Scotch-Irish | 100.0 /100 | #49 | Exceptional 22.6% |
| Sioux | 100.0 /100 | #50 | Exceptional 22.6% |
| Whites/Caucasians | 100.0 /100 | #51 | Exceptional 22.6% |
| Welsh | 100.0 /100 | #52 | Exceptional 22.6% |
| Czechs | 100.0 /100 | #53 | Exceptional 22.5% |