Immigrants from Nepal vs Immigrants from Caribbean 1 or more Vehicles in Household
COMPARE
Immigrants from Nepal
Immigrants from Caribbean
1 or more Vehicles in Household
1 or more Vehicles in Household Comparison
Immigrants from Nepal
Immigrants from Caribbean
89.5%
1 OR MORE VEHICLES IN HOUSEHOLD
38.9/ 100
METRIC RATING
188th/ 347
METRIC RANK
80.4%
1 OR MORE VEHICLES IN HOUSEHOLD
0.0/ 100
METRIC RATING
324th/ 347
METRIC RANK
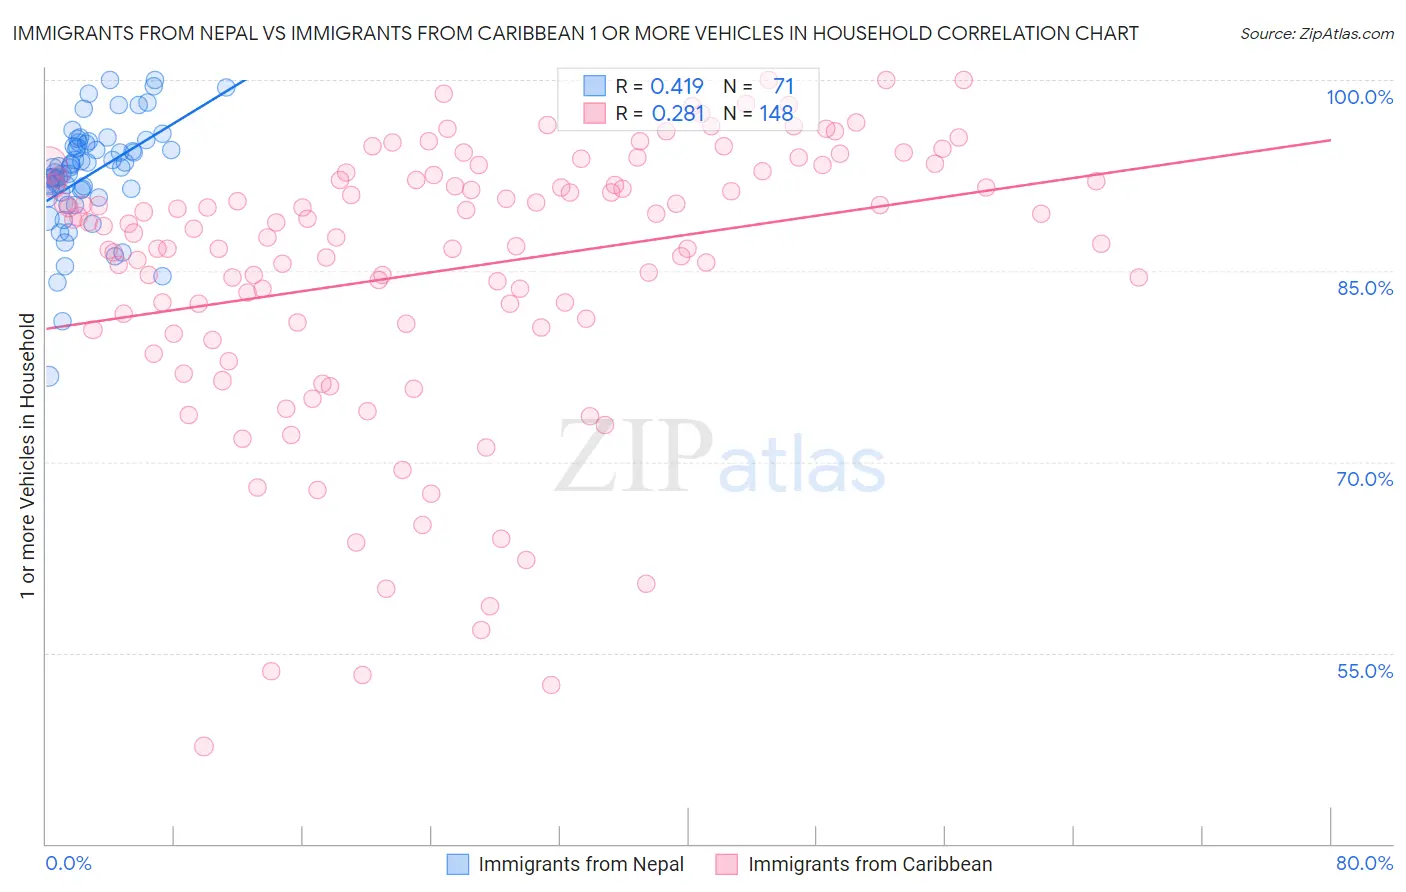
Immigrants from Nepal vs Immigrants from Caribbean 1 or more Vehicles in Household Correlation Chart
The statistical analysis conducted on geographies consisting of 186,489,458 people shows a moderate positive correlation between the proportion of Immigrants from Nepal and percentage of households with 1 or more vehicles available in the United States with a correlation coefficient (R) of 0.419 and weighted average of 89.5%. Similarly, the statistical analysis conducted on geographies consisting of 449,656,070 people shows a weak positive correlation between the proportion of Immigrants from Caribbean and percentage of households with 1 or more vehicles available in the United States with a correlation coefficient (R) of 0.281 and weighted average of 80.4%, a difference of 11.3%.
1 or more Vehicles in Household Correlation Summary
| Measurement | Immigrants from Nepal | Immigrants from Caribbean |
| Minimum | 76.8% | 47.7% |
| Maximum | 100.0% | 100.0% |
| Range | 23.2% | 52.3% |
| Mean | 92.6% | 85.1% |
| Median | 93.1% | 88.4% |
| Interquartile 25% (IQ1) | 91.1% | 80.9% |
| Interquartile 75% (IQ3) | 95.0% | 92.2% |
| Interquartile Range (IQR) | 3.9% | 11.3% |
| Standard Deviation (Sample) | 4.2% | 10.9% |
| Standard Deviation (Population) | 4.2% | 10.9% |
Similar Demographics by 1 or more Vehicles in Household
Demographics Similar to Immigrants from Nepal by 1 or more Vehicles in Household
In terms of 1 or more vehicles in household, the demographic groups most similar to Immigrants from Nepal are South American (89.5%, a difference of 0.010%), Immigrants from Brazil (89.6%, a difference of 0.020%), Pueblo (89.6%, a difference of 0.020%), Carpatho Rusyn (89.5%, a difference of 0.020%), and Shoshone (89.5%, a difference of 0.020%).
| Demographics | Rating | Rank | 1 or more Vehicles in Household |
| Immigrants | Ethiopia | 42.5 /100 | #181 | Average 89.6% |
| Ukrainians | 42.4 /100 | #182 | Average 89.6% |
| Ethiopians | 41.2 /100 | #183 | Average 89.6% |
| Immigrants | Bulgaria | 40.7 /100 | #184 | Average 89.6% |
| Immigrants | Brazil | 40.1 /100 | #185 | Average 89.6% |
| Pueblo | 39.9 /100 | #186 | Fair 89.6% |
| South Americans | 39.6 /100 | #187 | Fair 89.5% |
| Immigrants | Nepal | 38.9 /100 | #188 | Fair 89.5% |
| Carpatho Rusyns | 37.8 /100 | #189 | Fair 89.5% |
| Shoshone | 37.5 /100 | #190 | Fair 89.5% |
| Immigrants | Poland | 37.1 /100 | #191 | Fair 89.5% |
| Immigrants | North Macedonia | 36.5 /100 | #192 | Fair 89.5% |
| Immigrants | Northern Europe | 35.5 /100 | #193 | Fair 89.5% |
| Immigrants | Eritrea | 33.2 /100 | #194 | Fair 89.4% |
| Immigrants | Armenia | 31.8 /100 | #195 | Fair 89.4% |
Demographics Similar to Immigrants from Caribbean by 1 or more Vehicles in Household
In terms of 1 or more vehicles in household, the demographic groups most similar to Immigrants from Caribbean are Senegalese (80.4%, a difference of 0.10%), Immigrants from Yemen (80.5%, a difference of 0.11%), Immigrants from West Indies (79.5%, a difference of 1.2%), Immigrants from Cabo Verde (81.6%, a difference of 1.4%), and Immigrants from Senegal (79.0%, a difference of 1.8%).
| Demographics | Rating | Rank | 1 or more Vehicles in Household |
| Ghanaians | 0.0 /100 | #317 | Tragic 83.6% |
| Immigrants | Ghana | 0.0 /100 | #318 | Tragic 83.4% |
| Immigrants | Belarus | 0.0 /100 | #319 | Tragic 83.3% |
| Soviet Union | 0.0 /100 | #320 | Tragic 82.7% |
| Jamaicans | 0.0 /100 | #321 | Tragic 82.1% |
| Immigrants | Cabo Verde | 0.0 /100 | #322 | Tragic 81.6% |
| Immigrants | Yemen | 0.0 /100 | #323 | Tragic 80.5% |
| Immigrants | Caribbean | 0.0 /100 | #324 | Tragic 80.4% |
| Senegalese | 0.0 /100 | #325 | Tragic 80.4% |
| Immigrants | West Indies | 0.0 /100 | #326 | Tragic 79.5% |
| Immigrants | Senegal | 0.0 /100 | #327 | Tragic 79.0% |
| Ecuadorians | 0.0 /100 | #328 | Tragic 77.9% |
| Immigrants | Dominica | 0.0 /100 | #329 | Tragic 77.8% |
| Immigrants | Trinidad and Tobago | 0.0 /100 | #330 | Tragic 76.8% |
| West Indians | 0.0 /100 | #331 | Tragic 76.4% |