Marshallese vs Immigrants from Caribbean 1 or more Vehicles in Household
COMPARE
Marshallese
Immigrants from Caribbean
1 or more Vehicles in Household
1 or more Vehicles in Household Comparison
Marshallese
Immigrants from Caribbean
90.4%
1 OR MORE VEHICLES IN HOUSEHOLD
88.9/ 100
METRIC RATING
129th/ 347
METRIC RANK
80.4%
1 OR MORE VEHICLES IN HOUSEHOLD
0.0/ 100
METRIC RATING
324th/ 347
METRIC RANK
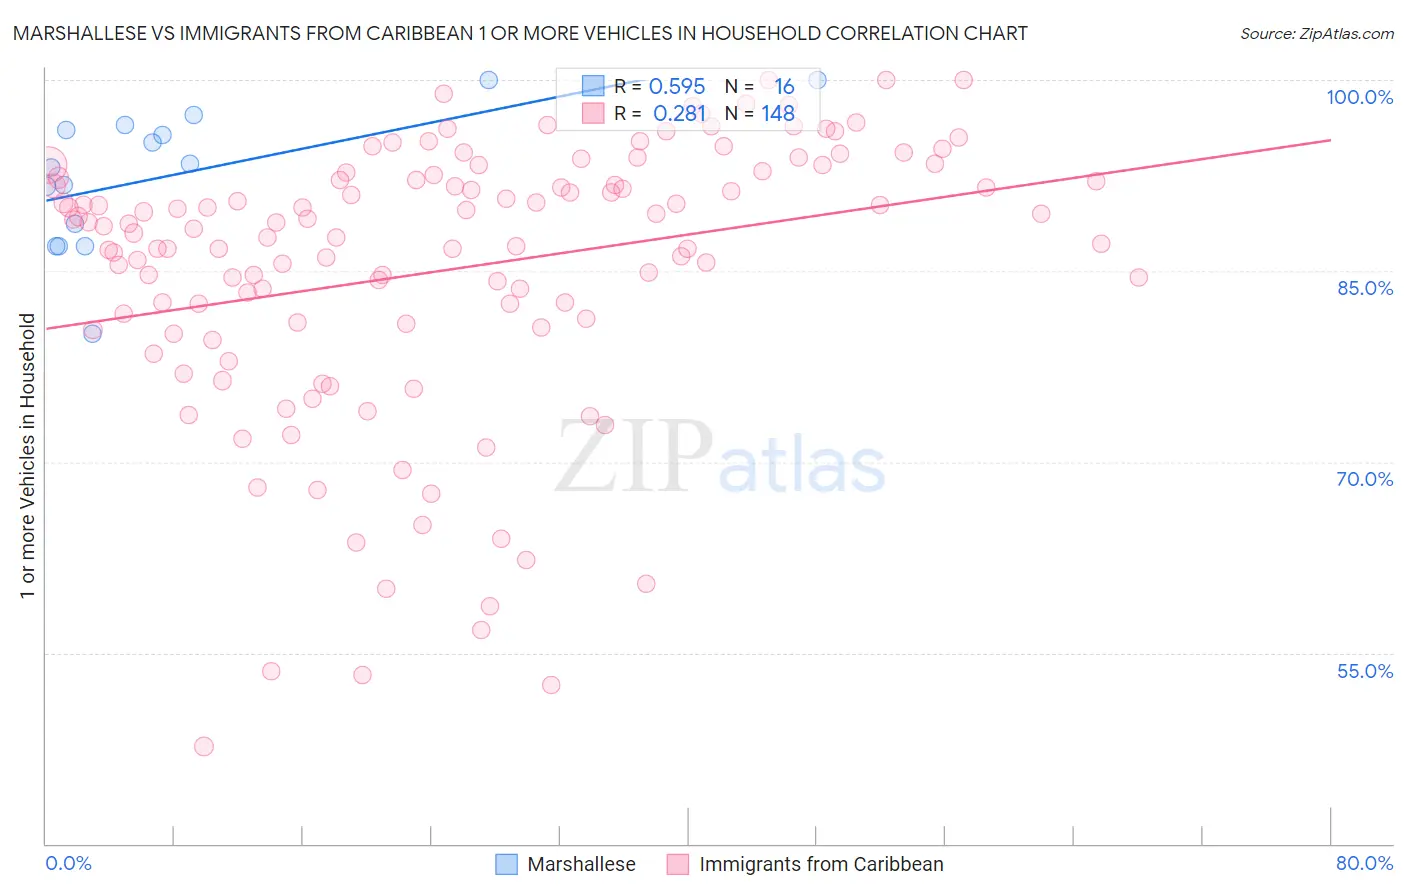
Marshallese vs Immigrants from Caribbean 1 or more Vehicles in Household Correlation Chart
The statistical analysis conducted on geographies consisting of 14,761,315 people shows a substantial positive correlation between the proportion of Marshallese and percentage of households with 1 or more vehicles available in the United States with a correlation coefficient (R) of 0.595 and weighted average of 90.4%. Similarly, the statistical analysis conducted on geographies consisting of 449,656,070 people shows a weak positive correlation between the proportion of Immigrants from Caribbean and percentage of households with 1 or more vehicles available in the United States with a correlation coefficient (R) of 0.281 and weighted average of 80.4%, a difference of 12.4%.
1 or more Vehicles in Household Correlation Summary
| Measurement | Marshallese | Immigrants from Caribbean |
| Minimum | 80.0% | 47.7% |
| Maximum | 100.0% | 100.0% |
| Range | 20.0% | 52.3% |
| Mean | 92.5% | 85.1% |
| Median | 93.3% | 88.4% |
| Interquartile 25% (IQ1) | 87.8% | 80.9% |
| Interquartile 75% (IQ3) | 96.3% | 92.2% |
| Interquartile Range (IQR) | 8.4% | 11.3% |
| Standard Deviation (Sample) | 5.5% | 10.9% |
| Standard Deviation (Population) | 5.3% | 10.9% |
Similar Demographics by 1 or more Vehicles in Household
Demographics Similar to Marshallese by 1 or more Vehicles in Household
In terms of 1 or more vehicles in household, the demographic groups most similar to Marshallese are Nicaraguan (90.4%, a difference of 0.0%), Immigrants from the Azores (90.4%, a difference of 0.010%), Burmese (90.4%, a difference of 0.010%), Immigrants from Cameroon (90.4%, a difference of 0.020%), and Immigrants from Kenya (90.4%, a difference of 0.020%).
| Demographics | Rating | Rank | 1 or more Vehicles in Household |
| Costa Ricans | 92.0 /100 | #122 | Exceptional 90.5% |
| Fijians | 91.8 /100 | #123 | Exceptional 90.5% |
| Puget Sound Salish | 91.5 /100 | #124 | Exceptional 90.5% |
| Immigrants | Korea | 90.5 /100 | #125 | Exceptional 90.5% |
| Immigrants | Cameroon | 89.4 /100 | #126 | Excellent 90.4% |
| Immigrants | Azores | 89.1 /100 | #127 | Excellent 90.4% |
| Burmese | 89.0 /100 | #128 | Excellent 90.4% |
| Marshallese | 88.9 /100 | #129 | Excellent 90.4% |
| Nicaraguans | 88.8 /100 | #130 | Excellent 90.4% |
| Immigrants | Kenya | 88.5 /100 | #131 | Excellent 90.4% |
| Immigrants | South Africa | 88.1 /100 | #132 | Excellent 90.4% |
| Immigrants | Syria | 87.5 /100 | #133 | Excellent 90.4% |
| Kenyans | 87.0 /100 | #134 | Excellent 90.4% |
| Immigrants | Oceania | 86.9 /100 | #135 | Excellent 90.4% |
| Hungarians | 86.5 /100 | #136 | Excellent 90.3% |
Demographics Similar to Immigrants from Caribbean by 1 or more Vehicles in Household
In terms of 1 or more vehicles in household, the demographic groups most similar to Immigrants from Caribbean are Senegalese (80.4%, a difference of 0.10%), Immigrants from Yemen (80.5%, a difference of 0.11%), Immigrants from West Indies (79.5%, a difference of 1.2%), Immigrants from Cabo Verde (81.6%, a difference of 1.4%), and Immigrants from Senegal (79.0%, a difference of 1.8%).
| Demographics | Rating | Rank | 1 or more Vehicles in Household |
| Ghanaians | 0.0 /100 | #317 | Tragic 83.6% |
| Immigrants | Ghana | 0.0 /100 | #318 | Tragic 83.4% |
| Immigrants | Belarus | 0.0 /100 | #319 | Tragic 83.3% |
| Soviet Union | 0.0 /100 | #320 | Tragic 82.7% |
| Jamaicans | 0.0 /100 | #321 | Tragic 82.1% |
| Immigrants | Cabo Verde | 0.0 /100 | #322 | Tragic 81.6% |
| Immigrants | Yemen | 0.0 /100 | #323 | Tragic 80.5% |
| Immigrants | Caribbean | 0.0 /100 | #324 | Tragic 80.4% |
| Senegalese | 0.0 /100 | #325 | Tragic 80.4% |
| Immigrants | West Indies | 0.0 /100 | #326 | Tragic 79.5% |
| Immigrants | Senegal | 0.0 /100 | #327 | Tragic 79.0% |
| Ecuadorians | 0.0 /100 | #328 | Tragic 77.9% |
| Immigrants | Dominica | 0.0 /100 | #329 | Tragic 77.8% |
| Immigrants | Trinidad and Tobago | 0.0 /100 | #330 | Tragic 76.8% |
| West Indians | 0.0 /100 | #331 | Tragic 76.4% |