Immigrants from Nepal vs Iraqi 1 or more Vehicles in Household
COMPARE
Immigrants from Nepal
Iraqi
1 or more Vehicles in Household
1 or more Vehicles in Household Comparison
Immigrants from Nepal
Iraqis
89.5%
1 OR MORE VEHICLES IN HOUSEHOLD
38.9/ 100
METRIC RATING
188th/ 347
METRIC RANK
91.9%
1 OR MORE VEHICLES IN HOUSEHOLD
99.8/ 100
METRIC RATING
57th/ 347
METRIC RANK
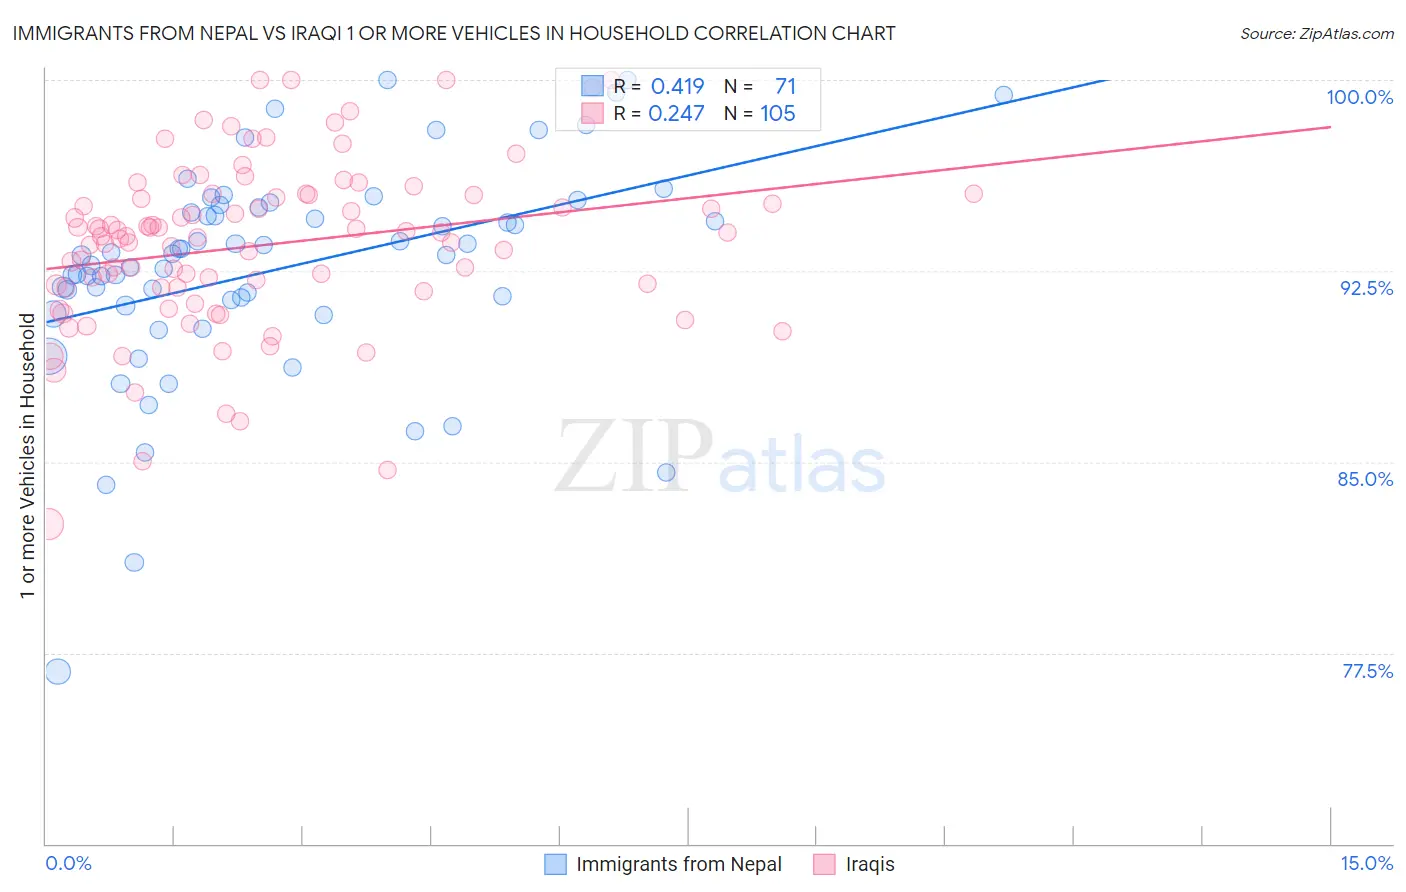
Immigrants from Nepal vs Iraqi 1 or more Vehicles in Household Correlation Chart
The statistical analysis conducted on geographies consisting of 186,489,458 people shows a moderate positive correlation between the proportion of Immigrants from Nepal and percentage of households with 1 or more vehicles available in the United States with a correlation coefficient (R) of 0.419 and weighted average of 89.5%. Similarly, the statistical analysis conducted on geographies consisting of 170,619,980 people shows a weak positive correlation between the proportion of Iraqis and percentage of households with 1 or more vehicles available in the United States with a correlation coefficient (R) of 0.247 and weighted average of 91.9%, a difference of 2.7%.
1 or more Vehicles in Household Correlation Summary
| Measurement | Immigrants from Nepal | Iraqi |
| Minimum | 76.8% | 82.6% |
| Maximum | 100.0% | 100.0% |
| Range | 23.2% | 17.4% |
| Mean | 92.6% | 93.5% |
| Median | 93.1% | 93.9% |
| Interquartile 25% (IQ1) | 91.1% | 91.8% |
| Interquartile 75% (IQ3) | 95.0% | 95.5% |
| Interquartile Range (IQR) | 3.9% | 3.6% |
| Standard Deviation (Sample) | 4.2% | 3.3% |
| Standard Deviation (Population) | 4.2% | 3.3% |
Similar Demographics by 1 or more Vehicles in Household
Demographics Similar to Immigrants from Nepal by 1 or more Vehicles in Household
In terms of 1 or more vehicles in household, the demographic groups most similar to Immigrants from Nepal are South American (89.5%, a difference of 0.010%), Immigrants from Brazil (89.6%, a difference of 0.020%), Pueblo (89.6%, a difference of 0.020%), Carpatho Rusyn (89.5%, a difference of 0.020%), and Shoshone (89.5%, a difference of 0.020%).
| Demographics | Rating | Rank | 1 or more Vehicles in Household |
| Immigrants | Ethiopia | 42.5 /100 | #181 | Average 89.6% |
| Ukrainians | 42.4 /100 | #182 | Average 89.6% |
| Ethiopians | 41.2 /100 | #183 | Average 89.6% |
| Immigrants | Bulgaria | 40.7 /100 | #184 | Average 89.6% |
| Immigrants | Brazil | 40.1 /100 | #185 | Average 89.6% |
| Pueblo | 39.9 /100 | #186 | Fair 89.6% |
| South Americans | 39.6 /100 | #187 | Fair 89.5% |
| Immigrants | Nepal | 38.9 /100 | #188 | Fair 89.5% |
| Carpatho Rusyns | 37.8 /100 | #189 | Fair 89.5% |
| Shoshone | 37.5 /100 | #190 | Fair 89.5% |
| Immigrants | Poland | 37.1 /100 | #191 | Fair 89.5% |
| Immigrants | North Macedonia | 36.5 /100 | #192 | Fair 89.5% |
| Immigrants | Northern Europe | 35.5 /100 | #193 | Fair 89.5% |
| Immigrants | Eritrea | 33.2 /100 | #194 | Fair 89.4% |
| Immigrants | Armenia | 31.8 /100 | #195 | Fair 89.4% |
Demographics Similar to Iraqis by 1 or more Vehicles in Household
In terms of 1 or more vehicles in household, the demographic groups most similar to Iraqis are Immigrants from Mexico (91.9%, a difference of 0.020%), Venezuelan (91.9%, a difference of 0.030%), Immigrants from Afghanistan (92.0%, a difference of 0.040%), Immigrants from Venezuela (92.0%, a difference of 0.040%), and Slovak (91.9%, a difference of 0.050%).
| Demographics | Rating | Rank | 1 or more Vehicles in Household |
| Guamanians/Chamorros | 99.9 /100 | #50 | Exceptional 92.1% |
| Celtics | 99.9 /100 | #51 | Exceptional 92.1% |
| Koreans | 99.9 /100 | #52 | Exceptional 92.1% |
| Hawaiians | 99.9 /100 | #53 | Exceptional 92.0% |
| Slovenes | 99.9 /100 | #54 | Exceptional 92.0% |
| Immigrants | Afghanistan | 99.9 /100 | #55 | Exceptional 92.0% |
| Immigrants | Venezuela | 99.9 /100 | #56 | Exceptional 92.0% |
| Iraqis | 99.8 /100 | #57 | Exceptional 91.9% |
| Immigrants | Mexico | 99.8 /100 | #58 | Exceptional 91.9% |
| Venezuelans | 99.8 /100 | #59 | Exceptional 91.9% |
| Slovaks | 99.8 /100 | #60 | Exceptional 91.9% |
| Immigrants | India | 99.8 /100 | #61 | Exceptional 91.9% |
| Thais | 99.8 /100 | #62 | Exceptional 91.9% |
| Chinese | 99.8 /100 | #63 | Exceptional 91.9% |
| Croatians | 99.8 /100 | #64 | Exceptional 91.9% |