Immigrants from Nepal vs Immigrants from Norway 1 or more Vehicles in Household
COMPARE
Immigrants from Nepal
Immigrants from Norway
1 or more Vehicles in Household
1 or more Vehicles in Household Comparison
Immigrants from Nepal
Immigrants from Norway
89.5%
1 OR MORE VEHICLES IN HOUSEHOLD
38.9/ 100
METRIC RATING
188th/ 347
METRIC RANK
88.7%
1 OR MORE VEHICLES IN HOUSEHOLD
5.5/ 100
METRIC RATING
228th/ 347
METRIC RANK
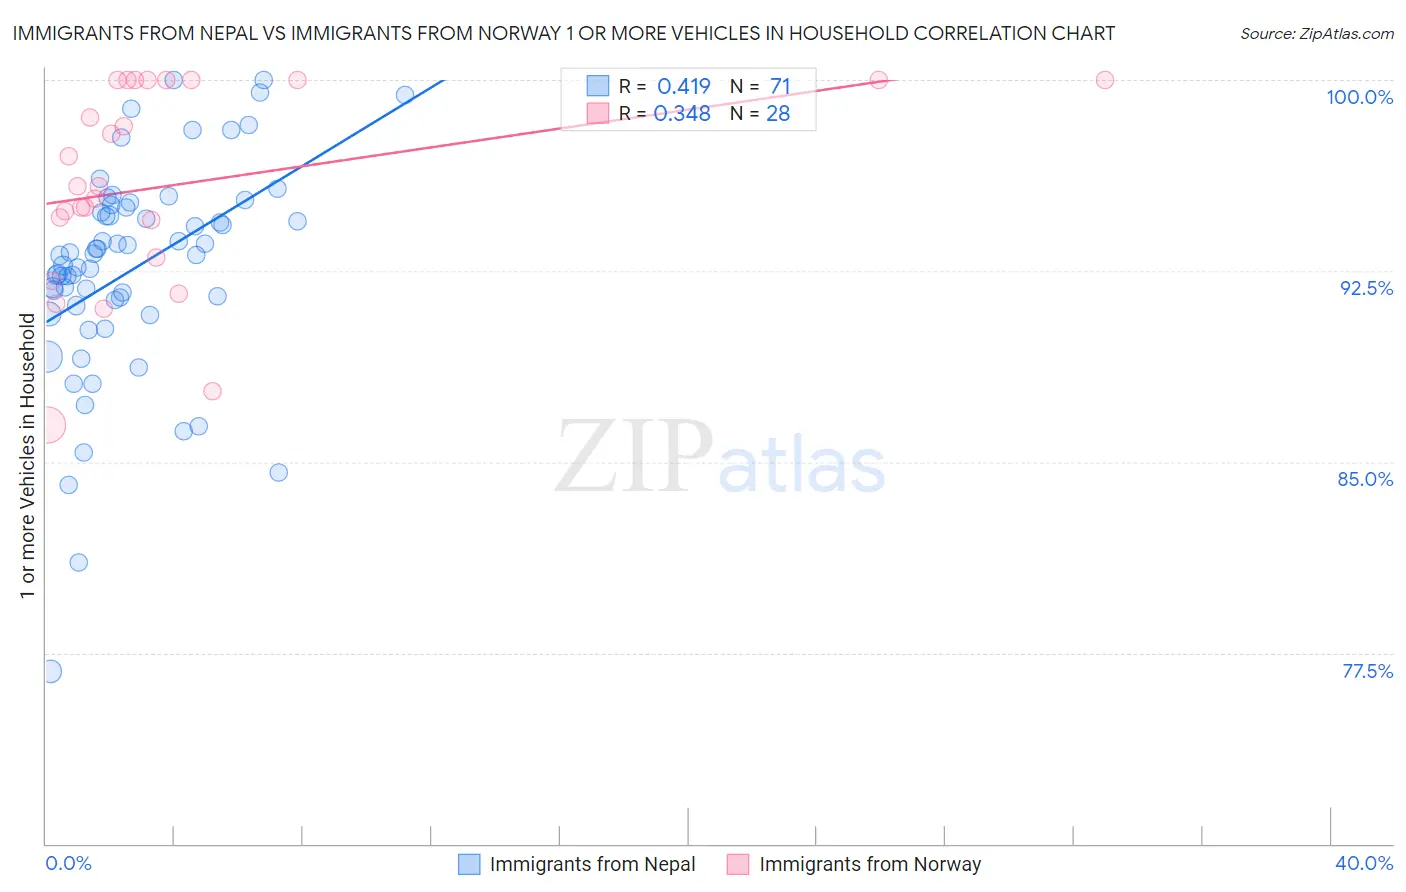
Immigrants from Nepal vs Immigrants from Norway 1 or more Vehicles in Household Correlation Chart
The statistical analysis conducted on geographies consisting of 186,489,458 people shows a moderate positive correlation between the proportion of Immigrants from Nepal and percentage of households with 1 or more vehicles available in the United States with a correlation coefficient (R) of 0.419 and weighted average of 89.5%. Similarly, the statistical analysis conducted on geographies consisting of 116,609,414 people shows a mild positive correlation between the proportion of Immigrants from Norway and percentage of households with 1 or more vehicles available in the United States with a correlation coefficient (R) of 0.348 and weighted average of 88.7%, a difference of 0.94%.
1 or more Vehicles in Household Correlation Summary
| Measurement | Immigrants from Nepal | Immigrants from Norway |
| Minimum | 76.8% | 86.5% |
| Maximum | 100.0% | 100.0% |
| Range | 23.2% | 13.5% |
| Mean | 92.6% | 95.9% |
| Median | 93.1% | 95.8% |
| Interquartile 25% (IQ1) | 91.1% | 93.7% |
| Interquartile 75% (IQ3) | 95.0% | 100.0% |
| Interquartile Range (IQR) | 3.9% | 6.3% |
| Standard Deviation (Sample) | 4.2% | 3.9% |
| Standard Deviation (Population) | 4.2% | 3.9% |
Similar Demographics by 1 or more Vehicles in Household
Demographics Similar to Immigrants from Nepal by 1 or more Vehicles in Household
In terms of 1 or more vehicles in household, the demographic groups most similar to Immigrants from Nepal are South American (89.5%, a difference of 0.010%), Immigrants from Brazil (89.6%, a difference of 0.020%), Pueblo (89.6%, a difference of 0.020%), Carpatho Rusyn (89.5%, a difference of 0.020%), and Shoshone (89.5%, a difference of 0.020%).
| Demographics | Rating | Rank | 1 or more Vehicles in Household |
| Immigrants | Ethiopia | 42.5 /100 | #181 | Average 89.6% |
| Ukrainians | 42.4 /100 | #182 | Average 89.6% |
| Ethiopians | 41.2 /100 | #183 | Average 89.6% |
| Immigrants | Bulgaria | 40.7 /100 | #184 | Average 89.6% |
| Immigrants | Brazil | 40.1 /100 | #185 | Average 89.6% |
| Pueblo | 39.9 /100 | #186 | Fair 89.6% |
| South Americans | 39.6 /100 | #187 | Fair 89.5% |
| Immigrants | Nepal | 38.9 /100 | #188 | Fair 89.5% |
| Carpatho Rusyns | 37.8 /100 | #189 | Fair 89.5% |
| Shoshone | 37.5 /100 | #190 | Fair 89.5% |
| Immigrants | Poland | 37.1 /100 | #191 | Fair 89.5% |
| Immigrants | North Macedonia | 36.5 /100 | #192 | Fair 89.5% |
| Immigrants | Northern Europe | 35.5 /100 | #193 | Fair 89.5% |
| Immigrants | Eritrea | 33.2 /100 | #194 | Fair 89.4% |
| Immigrants | Armenia | 31.8 /100 | #195 | Fair 89.4% |
Demographics Similar to Immigrants from Norway by 1 or more Vehicles in Household
In terms of 1 or more vehicles in household, the demographic groups most similar to Immigrants from Norway are Cheyenne (88.7%, a difference of 0.010%), Ute (88.7%, a difference of 0.010%), Immigrants from Romania (88.7%, a difference of 0.010%), Immigrants from Sierra Leone (88.7%, a difference of 0.030%), and Cree (88.7%, a difference of 0.040%).
| Demographics | Rating | Rank | 1 or more Vehicles in Household |
| Peruvians | 7.9 /100 | #221 | Tragic 88.8% |
| Uruguayans | 7.0 /100 | #222 | Tragic 88.8% |
| Immigrants | South America | 7.0 /100 | #223 | Tragic 88.8% |
| Immigrants | Hong Kong | 6.2 /100 | #224 | Tragic 88.7% |
| Cree | 6.0 /100 | #225 | Tragic 88.7% |
| Cheyenne | 5.7 /100 | #226 | Tragic 88.7% |
| Ute | 5.6 /100 | #227 | Tragic 88.7% |
| Immigrants | Norway | 5.5 /100 | #228 | Tragic 88.7% |
| Immigrants | Romania | 5.4 /100 | #229 | Tragic 88.7% |
| Immigrants | Sierra Leone | 5.2 /100 | #230 | Tragic 88.7% |
| Russians | 5.0 /100 | #231 | Tragic 88.7% |
| Immigrants | Japan | 4.9 /100 | #232 | Tragic 88.7% |
| Houma | 4.8 /100 | #233 | Tragic 88.6% |
| Immigrants | Peru | 4.7 /100 | #234 | Tragic 88.6% |
| Paiute | 4.6 /100 | #235 | Tragic 88.6% |