Immigrants from Morocco vs Immigrants from Micronesia 1 or more Vehicles in Household
COMPARE
Immigrants from Morocco
Immigrants from Micronesia
1 or more Vehicles in Household
1 or more Vehicles in Household Comparison
Immigrants from Morocco
Immigrants from Micronesia
87.4%
1 OR MORE VEHICLES IN HOUSEHOLD
0.1/ 100
METRIC RATING
274th/ 347
METRIC RANK
90.1%
1 OR MORE VEHICLES IN HOUSEHOLD
75.9/ 100
METRIC RATING
150th/ 347
METRIC RANK
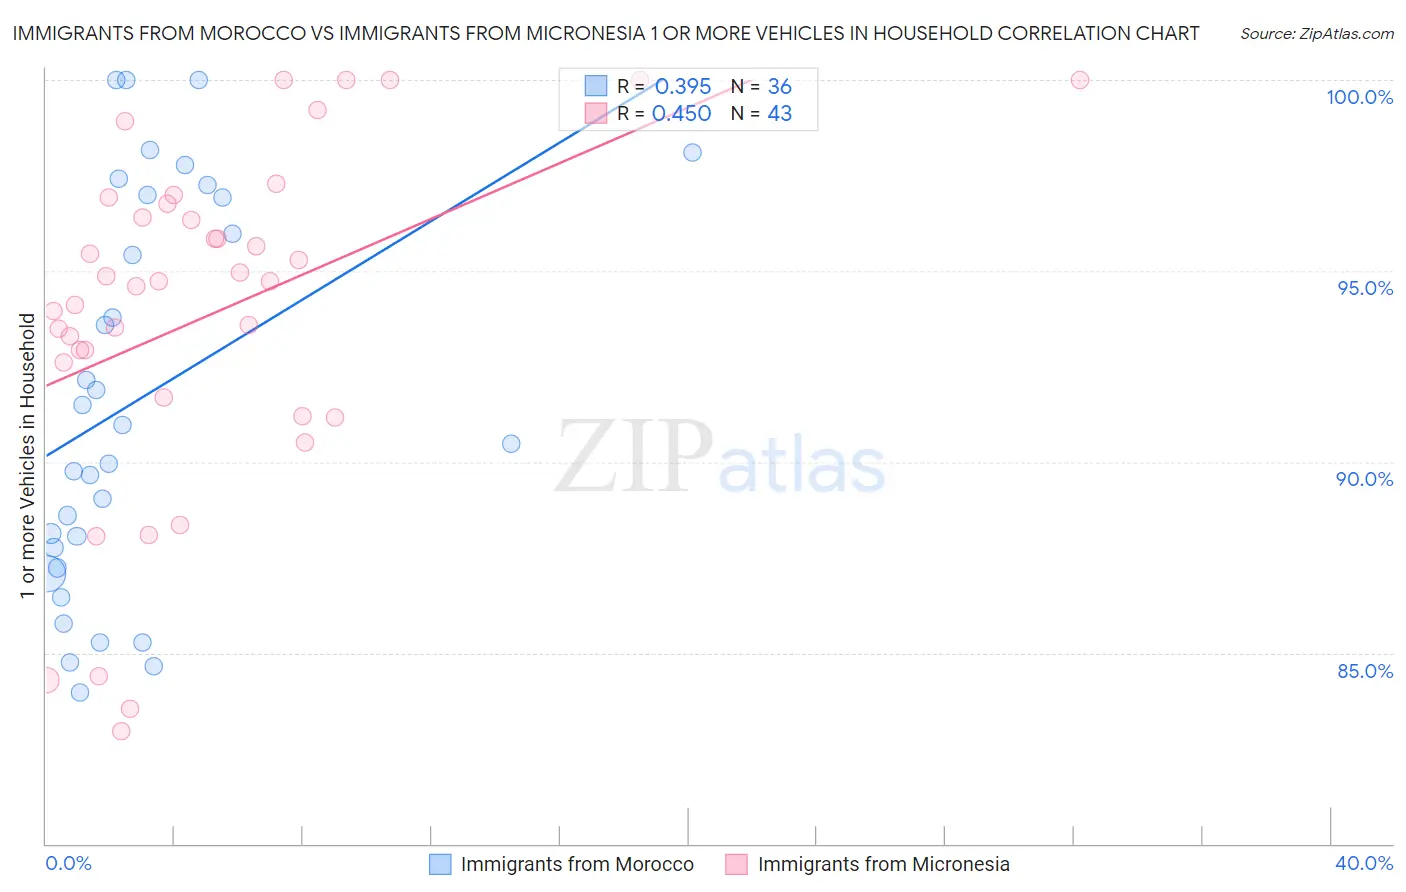
Immigrants from Morocco vs Immigrants from Micronesia 1 or more Vehicles in Household Correlation Chart
The statistical analysis conducted on geographies consisting of 178,835,881 people shows a mild positive correlation between the proportion of Immigrants from Morocco and percentage of households with 1 or more vehicles available in the United States with a correlation coefficient (R) of 0.395 and weighted average of 87.4%. Similarly, the statistical analysis conducted on geographies consisting of 61,591,588 people shows a moderate positive correlation between the proportion of Immigrants from Micronesia and percentage of households with 1 or more vehicles available in the United States with a correlation coefficient (R) of 0.450 and weighted average of 90.1%, a difference of 3.1%.
1 or more Vehicles in Household Correlation Summary
| Measurement | Immigrants from Morocco | Immigrants from Micronesia |
| Minimum | 84.0% | 83.0% |
| Maximum | 100.0% | 100.0% |
| Range | 16.0% | 17.0% |
| Mean | 91.7% | 93.8% |
| Median | 90.7% | 94.7% |
| Interquartile 25% (IQ1) | 87.5% | 91.7% |
| Interquartile 75% (IQ3) | 96.9% | 96.8% |
| Interquartile Range (IQR) | 9.5% | 5.1% |
| Standard Deviation (Sample) | 5.1% | 4.5% |
| Standard Deviation (Population) | 5.0% | 4.5% |
Similar Demographics by 1 or more Vehicles in Household
Demographics Similar to Immigrants from Morocco by 1 or more Vehicles in Household
In terms of 1 or more vehicles in household, the demographic groups most similar to Immigrants from Morocco are Immigrants from Northern Africa (87.4%, a difference of 0.030%), Aleut (87.5%, a difference of 0.080%), Bermudan (87.5%, a difference of 0.14%), Panamanian (87.5%, a difference of 0.15%), and Immigrants from Africa (87.6%, a difference of 0.16%).
| Demographics | Rating | Rank | 1 or more Vehicles in Household |
| Immigrants | Colombia | 0.3 /100 | #267 | Tragic 87.6% |
| Immigrants | Europe | 0.2 /100 | #268 | Tragic 87.6% |
| Immigrants | Africa | 0.2 /100 | #269 | Tragic 87.6% |
| Panamanians | 0.2 /100 | #270 | Tragic 87.5% |
| Bermudans | 0.2 /100 | #271 | Tragic 87.5% |
| Aleuts | 0.2 /100 | #272 | Tragic 87.5% |
| Immigrants | Northern Africa | 0.2 /100 | #273 | Tragic 87.4% |
| Immigrants | Morocco | 0.1 /100 | #274 | Tragic 87.4% |
| Immigrants | Singapore | 0.1 /100 | #275 | Tragic 87.2% |
| Immigrants | France | 0.1 /100 | #276 | Tragic 87.1% |
| Alsatians | 0.1 /100 | #277 | Tragic 87.1% |
| Immigrants | Southern Europe | 0.1 /100 | #278 | Tragic 87.1% |
| Immigrants | Albania | 0.1 /100 | #279 | Tragic 87.1% |
| Immigrants | Croatia | 0.0 /100 | #280 | Tragic 87.0% |
| Mongolians | 0.0 /100 | #281 | Tragic 87.0% |
Demographics Similar to Immigrants from Micronesia by 1 or more Vehicles in Household
In terms of 1 or more vehicles in household, the demographic groups most similar to Immigrants from Micronesia are Immigrants from Bosnia and Herzegovina (90.1%, a difference of 0.010%), Immigrants from Nicaragua (90.1%, a difference of 0.020%), Tlingit-Haida (90.1%, a difference of 0.030%), New Zealander (90.1%, a difference of 0.040%), and Immigrants from Uganda (90.1%, a difference of 0.040%).
| Demographics | Rating | Rank | 1 or more Vehicles in Household |
| Immigrants | Bahamas | 81.5 /100 | #143 | Excellent 90.2% |
| Immigrants | Zimbabwe | 81.5 /100 | #144 | Excellent 90.2% |
| Sioux | 81.3 /100 | #145 | Excellent 90.2% |
| Bahamians | 80.5 /100 | #146 | Excellent 90.2% |
| Chileans | 79.8 /100 | #147 | Good 90.2% |
| Immigrants | Eastern Africa | 78.2 /100 | #148 | Good 90.1% |
| Immigrants | Nicaragua | 76.7 /100 | #149 | Good 90.1% |
| Immigrants | Micronesia | 75.9 /100 | #150 | Good 90.1% |
| Immigrants | Bosnia and Herzegovina | 75.4 /100 | #151 | Good 90.1% |
| Tlingit-Haida | 74.3 /100 | #152 | Good 90.1% |
| New Zealanders | 73.8 /100 | #153 | Good 90.1% |
| Immigrants | Uganda | 73.8 /100 | #154 | Good 90.1% |
| Immigrants | Immigrants | 73.6 /100 | #155 | Good 90.1% |
| Australians | 72.4 /100 | #156 | Good 90.0% |
| Immigrants | Congo | 71.2 /100 | #157 | Good 90.0% |