Immigrants from Morocco vs Welsh 1 or more Vehicles in Household
COMPARE
Immigrants from Morocco
Welsh
1 or more Vehicles in Household
1 or more Vehicles in Household Comparison
Immigrants from Morocco
Welsh
87.4%
1 OR MORE VEHICLES IN HOUSEHOLD
0.1/ 100
METRIC RATING
274th/ 347
METRIC RANK
93.0%
1 OR MORE VEHICLES IN HOUSEHOLD
100.0/ 100
METRIC RATING
18th/ 347
METRIC RANK
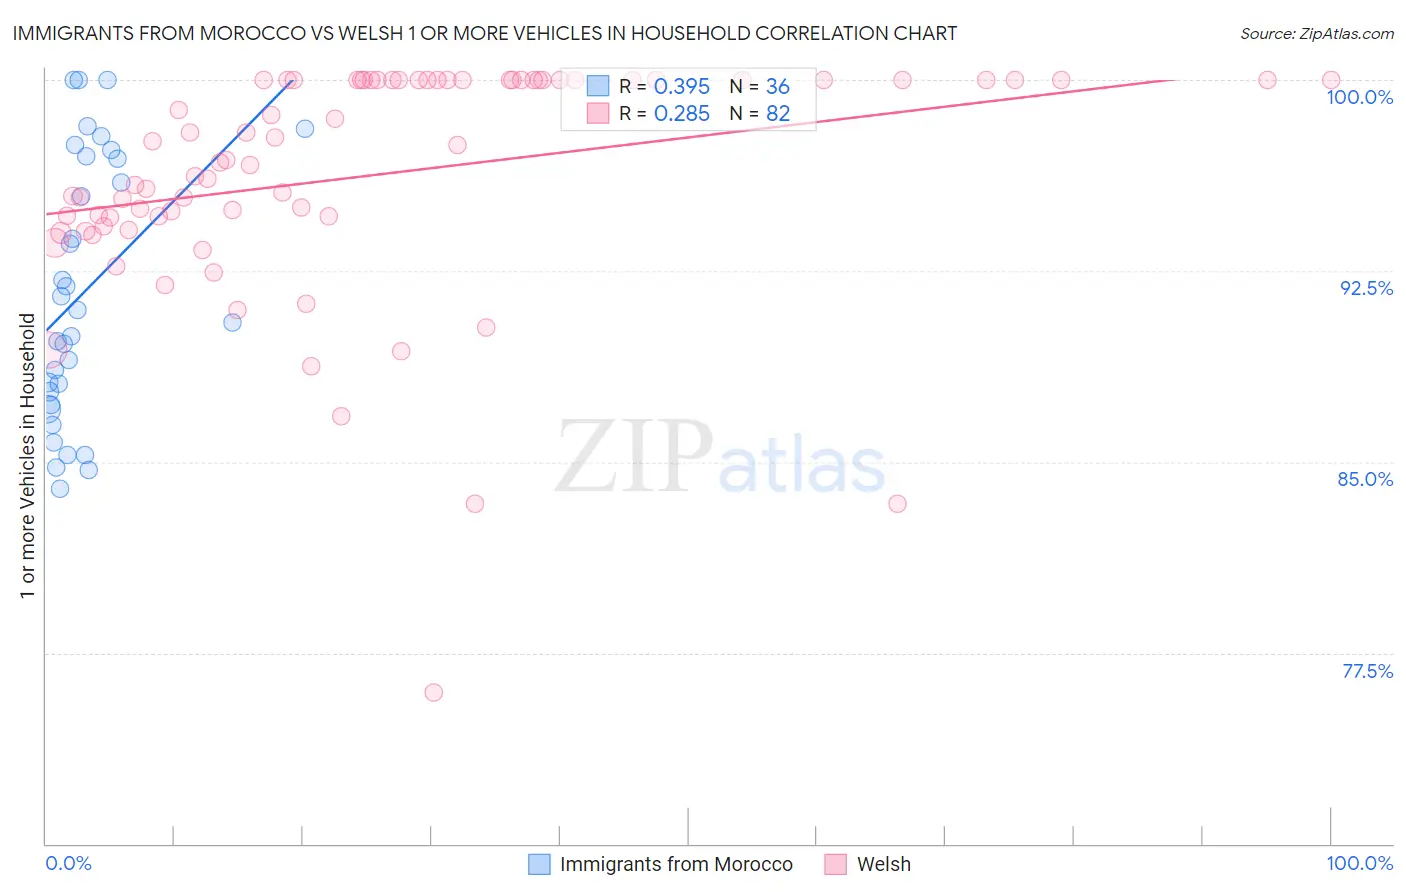
Immigrants from Morocco vs Welsh 1 or more Vehicles in Household Correlation Chart
The statistical analysis conducted on geographies consisting of 178,835,881 people shows a mild positive correlation between the proportion of Immigrants from Morocco and percentage of households with 1 or more vehicles available in the United States with a correlation coefficient (R) of 0.395 and weighted average of 87.4%. Similarly, the statistical analysis conducted on geographies consisting of 528,258,241 people shows a weak positive correlation between the proportion of Welsh and percentage of households with 1 or more vehicles available in the United States with a correlation coefficient (R) of 0.285 and weighted average of 93.0%, a difference of 6.4%.
1 or more Vehicles in Household Correlation Summary
| Measurement | Immigrants from Morocco | Welsh |
| Minimum | 84.0% | 75.9% |
| Maximum | 100.0% | 100.0% |
| Range | 16.0% | 24.1% |
| Mean | 91.7% | 96.3% |
| Median | 90.7% | 97.1% |
| Interquartile 25% (IQ1) | 87.5% | 94.6% |
| Interquartile 75% (IQ3) | 96.9% | 100.0% |
| Interquartile Range (IQR) | 9.5% | 5.4% |
| Standard Deviation (Sample) | 5.1% | 4.6% |
| Standard Deviation (Population) | 5.0% | 4.5% |
Similar Demographics by 1 or more Vehicles in Household
Demographics Similar to Immigrants from Morocco by 1 or more Vehicles in Household
In terms of 1 or more vehicles in household, the demographic groups most similar to Immigrants from Morocco are Immigrants from Northern Africa (87.4%, a difference of 0.030%), Aleut (87.5%, a difference of 0.080%), Bermudan (87.5%, a difference of 0.14%), Panamanian (87.5%, a difference of 0.15%), and Immigrants from Africa (87.6%, a difference of 0.16%).
| Demographics | Rating | Rank | 1 or more Vehicles in Household |
| Immigrants | Colombia | 0.3 /100 | #267 | Tragic 87.6% |
| Immigrants | Europe | 0.2 /100 | #268 | Tragic 87.6% |
| Immigrants | Africa | 0.2 /100 | #269 | Tragic 87.6% |
| Panamanians | 0.2 /100 | #270 | Tragic 87.5% |
| Bermudans | 0.2 /100 | #271 | Tragic 87.5% |
| Aleuts | 0.2 /100 | #272 | Tragic 87.5% |
| Immigrants | Northern Africa | 0.2 /100 | #273 | Tragic 87.4% |
| Immigrants | Morocco | 0.1 /100 | #274 | Tragic 87.4% |
| Immigrants | Singapore | 0.1 /100 | #275 | Tragic 87.2% |
| Immigrants | France | 0.1 /100 | #276 | Tragic 87.1% |
| Alsatians | 0.1 /100 | #277 | Tragic 87.1% |
| Immigrants | Southern Europe | 0.1 /100 | #278 | Tragic 87.1% |
| Immigrants | Albania | 0.1 /100 | #279 | Tragic 87.1% |
| Immigrants | Croatia | 0.0 /100 | #280 | Tragic 87.0% |
| Mongolians | 0.0 /100 | #281 | Tragic 87.0% |
Demographics Similar to Welsh by 1 or more Vehicles in Household
In terms of 1 or more vehicles in household, the demographic groups most similar to Welsh are European (93.0%, a difference of 0.040%), Mexican (93.0%, a difference of 0.060%), Assyrian/Chaldean/Syriac (93.0%, a difference of 0.060%), Irish (93.1%, a difference of 0.080%), and White/Caucasian (93.1%, a difference of 0.12%).
| Demographics | Rating | Rank | 1 or more Vehicles in Household |
| Czechs | 100.0 /100 | #11 | Exceptional 93.3% |
| Scandinavians | 100.0 /100 | #12 | Exceptional 93.1% |
| Whites/Caucasians | 100.0 /100 | #13 | Exceptional 93.1% |
| Irish | 100.0 /100 | #14 | Exceptional 93.1% |
| Mexicans | 100.0 /100 | #15 | Exceptional 93.0% |
| Assyrians/Chaldeans/Syriacs | 100.0 /100 | #16 | Exceptional 93.0% |
| Europeans | 100.0 /100 | #17 | Exceptional 93.0% |
| Welsh | 100.0 /100 | #18 | Exceptional 93.0% |
| Tongans | 100.0 /100 | #19 | Exceptional 92.9% |
| Arapaho | 100.0 /100 | #20 | Exceptional 92.7% |
| Ottawa | 100.0 /100 | #21 | Exceptional 92.7% |
| French | 100.0 /100 | #22 | Exceptional 92.7% |
| Nepalese | 100.0 /100 | #23 | Exceptional 92.6% |
| Yaqui | 100.0 /100 | #24 | Exceptional 92.6% |
| Immigrants | Iraq | 100.0 /100 | #25 | Exceptional 92.5% |