Immigrants from Morocco vs Immigrants from Micronesia Child Poverty Under the Age of 16

COMPARE

Immigrants from Morocco
Race
Ancestry
AfghanAfricanAlaska NativeAlaskan AthabascanAlbanianAleutAlsatianAmericanApacheArabArapahoArgentineanArmenianAssyrian/Chaldean/SyriacAustralianAustrianBahamianBangladeshiBarbadianBasqueBelgianBelizeanBermudanBhutaneseBlackfeetBolivianBrazilianBritishBritish West IndianBulgarianBurmeseCajunCambodianCanadianCape VerdeanCarpatho RusynCelticCentral AmericanCentral American IndianCherokeeCheyenneChickasawChileanChineseChippewaChoctawColombianColvilleComancheCosta RicanCreeCreekCroatianCrowCubanCypriotCzechCzechoslovakianDanishDelawareDominicanDutchDutch West IndianEastern EuropeanEcuadorianEgyptianEnglishEstonianEthiopianEuropeanFijianFilipinoFinnishFrenchFrench American IndianFrench CanadianGermanGerman RussianGhanaianGreekGuamanian/ChamorroGuatemalanGuyaneseHaitianHmongHonduranHopiHoumaHungarianIcelanderIndian (Asian)IndonesianInupiatIranianIraqiIrishIroquoisIsraeliItalianJamaicanJapaneseJordanianKenyanKiowaKoreanLaotianLatvianLebaneseLiberianLithuanianLumbeeLuxembourgerMacedonianMalaysianMalteseMarshalleseMenomineeMexicanMexican American IndianMongolianMoroccanNative HawaiianNavajoNepaleseNew ZealanderNicaraguanNigerianNorthern EuropeanNorwegianOkinawanOsageOttawaPaiutePakistaniPalestinianPanamanianParaguayanPennsylvania GermanPeruvianPimaPolishPortuguesePotawatomiPuebloPuerto RicanPuget Sound SalishRomanianRussianSalvadoranSamoanScandinavianScotch-IrishScottishSeminoleSenegaleseSerbianShoshoneSierra LeoneanSiouxSlavicSlovakSloveneSomaliSouth AfricanSouth AmericanSouth American IndianSoviet UnionSpaniardSpanishSpanish AmericanSpanish American IndianSri LankanSubsaharan AfricanSudaneseSwedishSwissSyrianTaiwaneseThaiTlingit-HaidaTohono O'OdhamTonganTrinidadian and TobagonianTsimshianTurkishU.S. Virgin IslanderUgandanUkrainianUruguayanUteVenezuelanVietnameseWelshWest IndianYakamaYaquiYugoslavianYumanYup'ikZimbabwean
Immigration
NonimmigrantsImmigrantsAfghanistanAfricaAlbaniaArgentinaArmeniaAsiaAustraliaAustriaBahamasBangladeshBarbadosBelarusBelgiumBelizeBoliviaBosnia and HerzegovinaBrazilBulgariaBurma/MyanmarCabo VerdeCambodiaCameroonCanadaCaribbeanCentral AmericaChileChinaColombiaCongoCosta RicaCroatiaCubaCzechoslovakiaDenmarkDominicaDominican RepublicEastern AfricaEastern AsiaEastern EuropeEcuadorEgyptEl SalvadorEnglandEritreaEthiopiaEuropeFijiFranceGermanyGhanaGreeceGrenadaGuatemalaGuyanaHaitiHondurasHong KongHungaryIndiaIndonesiaIranIraqIrelandIsraelItalyJamaicaJapanJordanKazakhstanKenyaKoreaKuwaitLaosLatin AmericaLatviaLebanonLiberiaLithuaniaMalaysiaMexicoMiddle AfricaMoldovaMoroccoNepalNetherlandsNicaraguaNigeriaNorth AmericaNorth MacedoniaNorthern AfricaNorthern EuropeNorwayOceaniaPakistanPanamaPeruPhilippinesPolandPortugalRomaniaRussiaSaudi ArabiaScotlandSenegalSerbiaSierra LeoneSingaporeSomaliaSouth AfricaSouth AmericaSouth Central AsiaSouth Eastern AsiaSouthern EuropeSpainSri LankaSt. Vincent and the GrenadinesSudanSwedenSwitzerlandSyriaTaiwanThailandTrinidad and TobagoTurkeyUgandaUkraineUruguayUzbekistanVenezuelaVietnamWest IndiesWestern AfricaWestern AsiaWestern EuropeYemenZaireZimbabweAzores
Immigrants from Micronesia
Race
Ancestry
AfghanAfricanAlaska NativeAlaskan AthabascanAlbanianAleutAlsatianAmericanApacheArabArapahoArgentineanArmenianAssyrian/Chaldean/SyriacAustralianAustrianBahamianBangladeshiBarbadianBasqueBelgianBelizeanBermudanBhutaneseBlackfeetBolivianBrazilianBritishBritish West IndianBulgarianBurmeseCajunCambodianCanadianCape VerdeanCarpatho RusynCelticCentral AmericanCentral American IndianCherokeeCheyenneChickasawChileanChineseChippewaChoctawColombianColvilleComancheCosta RicanCreeCreekCroatianCrowCubanCypriotCzechCzechoslovakianDanishDelawareDominicanDutchDutch West IndianEastern EuropeanEcuadorianEgyptianEnglishEstonianEthiopianEuropeanFijianFilipinoFinnishFrenchFrench American IndianFrench CanadianGermanGerman RussianGhanaianGreekGuamanian/ChamorroGuatemalanGuyaneseHaitianHmongHonduranHopiHoumaHungarianIcelanderIndian (Asian)IndonesianInupiatIranianIraqiIrishIroquoisIsraeliItalianJamaicanJapaneseJordanianKenyanKiowaKoreanLaotianLatvianLebaneseLiberianLithuanianLumbeeLuxembourgerMacedonianMalaysianMalteseMarshalleseMenomineeMexicanMexican American IndianMongolianMoroccanNative HawaiianNavajoNepaleseNew ZealanderNicaraguanNigerianNorthern EuropeanNorwegianOkinawanOsageOttawaPaiutePakistaniPalestinianPanamanianParaguayanPennsylvania GermanPeruvianPimaPolishPortuguesePotawatomiPuebloPuerto RicanPuget Sound SalishRomanianRussianSalvadoranSamoanScandinavianScotch-IrishScottishSeminoleSenegaleseSerbianShoshoneSierra LeoneanSiouxSlavicSlovakSloveneSomaliSouth AfricanSouth AmericanSouth American IndianSoviet UnionSpaniardSpanishSpanish AmericanSpanish American IndianSri LankanSubsaharan AfricanSudaneseSwedishSwissSyrianTaiwaneseThaiTlingit-HaidaTohono O'OdhamTonganTrinidadian and TobagonianTsimshianTurkishU.S. Virgin IslanderUgandanUkrainianUruguayanUteVenezuelanVietnameseWelshWest IndianYakamaYaquiYugoslavianYumanYup'ikZimbabwean
Immigration
NonimmigrantsImmigrantsAfghanistanAfricaAlbaniaArgentinaArmeniaAsiaAustraliaAustriaBahamasBangladeshBarbadosBelarusBelgiumBelizeBoliviaBosnia and HerzegovinaBrazilBulgariaBurma/MyanmarCabo VerdeCambodiaCameroonCanadaCaribbeanCentral AmericaChileChinaColombiaCongoCosta RicaCroatiaCubaCzechoslovakiaDenmarkDominicaDominican RepublicEastern AfricaEastern AsiaEastern EuropeEcuadorEgyptEl SalvadorEnglandEritreaEthiopiaEuropeFijiFranceGermanyGhanaGreeceGrenadaGuatemalaGuyanaHaitiHondurasHong KongHungaryIndiaIndonesiaIranIraqIrelandIsraelItalyJamaicaJapanJordanKazakhstanKenyaKoreaKuwaitLaosLatin AmericaLatviaLebanonLiberiaLithuaniaMalaysiaMexicoMicronesiaMiddle AfricaMoldovaNepalNetherlandsNicaraguaNigeriaNorth AmericaNorth MacedoniaNorthern AfricaNorthern EuropeNorwayOceaniaPakistanPanamaPeruPhilippinesPolandPortugalRomaniaRussiaSaudi ArabiaScotlandSenegalSerbiaSierra LeoneSingaporeSomaliaSouth AfricaSouth AmericaSouth Central AsiaSouth Eastern AsiaSouthern EuropeSpainSri LankaSt. Vincent and the GrenadinesSudanSwedenSwitzerlandSyriaTaiwanThailandTrinidad and TobagoTurkeyUgandaUkraineUruguayUzbekistanVenezuelaVietnamWest IndiesWestern AfricaWestern AsiaWestern EuropeYemenZaireZimbabweAzores
Child Poverty Under the Age of 16
Income
Poverty
Unemployment
Labor Participation
Family Structure
Vehicle Availability
Education Level
Disability

Child Poverty Under the Age of 16 Comparison

Immigrants from Morocco

Immigrants from Micronesia

Fair
Tragic
16.6%
CHILD POVERTY UNDER THE AGE OF 16
31.2/ 100
METRIC RATING
188th/ 347
METRIC RANK
18.0%
CHILD POVERTY UNDER THE AGE OF 16
2.3/ 100
METRIC RATING
228th/ 347
METRIC RANK

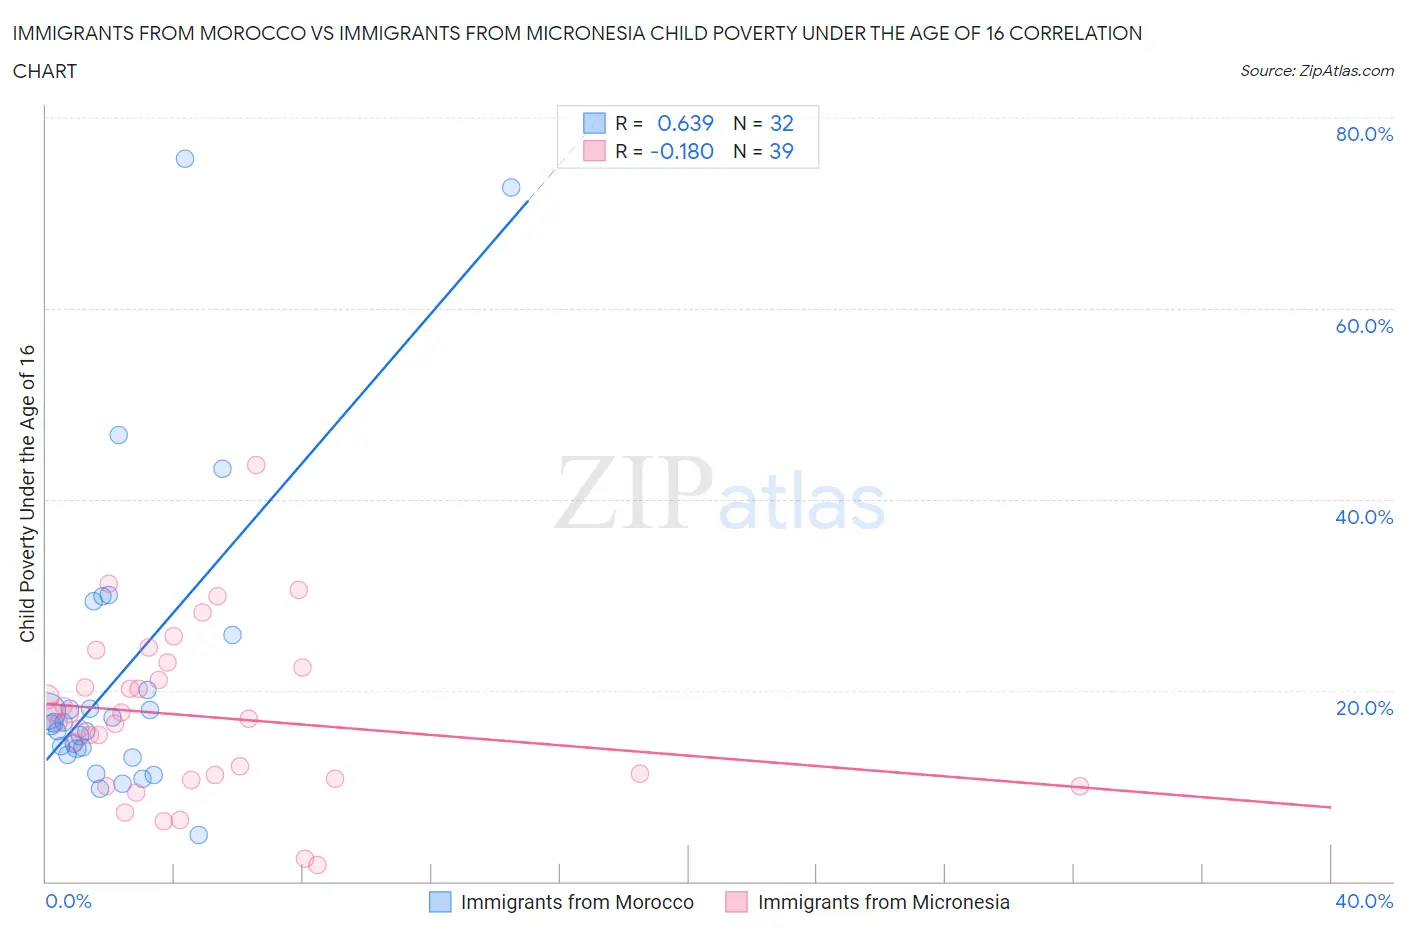
Immigrants from Morocco vs Immigrants from Micronesia Child Poverty Under the Age of 16 Correlation Chart

The statistical analysis conducted on geographies consisting of 178,413,741 people shows a significant positive correlation between the proportion of Immigrants from Morocco and poverty level among children under the age of 16 in the United States with a correlation coefficient (R) of 0.639 and weighted average of 16.6%. Similarly, the statistical analysis conducted on geographies consisting of 61,555,801 people shows a poor negative correlation between the proportion of Immigrants from Micronesia and poverty level among children under the age of 16 in the United States with a correlation coefficient (R) of -0.180 and weighted average of 18.0%, a difference of 8.6%.
Immigrants from Morocco vs Immigrants from Micronesia Child Poverty Under the Age of 16

Child Poverty Under the Age of 16 Correlation Summary

MeasurementImmigrants from MoroccoImmigrants from Micronesia
Minimum4.9%1.7%
Maximum75.7%43.7%
Range70.8%41.9%
Mean21.8%17.3%
Median16.5%17.0%
Interquartile 25% (IQ1)13.5%10.7%
Interquartile 75% (IQ3)22.9%22.3%
Interquartile Range (IQR)9.4%11.6%
Standard Deviation (Sample)16.4%8.6%
Standard Deviation (Population)16.2%8.5%

Similar Demographics by Child Poverty Under the Age of 16

Demographics Similar to Immigrants from Morocco by Child Poverty Under the Age of 16

In terms of child poverty under the age of 16, the demographic groups most similar to Immigrants from Morocco are Arab (16.6%, a difference of 0.020%), Immigrants from Portugal (16.6%, a difference of 0.17%), Immigrants from Costa Rica (16.6%, a difference of 0.22%), Kenyan (16.5%, a difference of 0.38%), and Immigrants from Iraq (16.7%, a difference of 0.42%).
DemographicsRating | RankChild Poverty Under the Age of 16
Immigrants | South America
40.8
/100
|
#181
Average
16.4%
Hawaiians
38.2
/100
|
#182
Fair
16.4%
Celtics
38.2
/100
|
#183
Fair
16.4%
Immigrants | Western Asia
38.0
/100
|
#184
Fair
16.4%
Immigrants | Bosnia and Herzegovina
37.4
/100
|
#185
Fair
16.5%
Kenyans
34.1
/100
|
#186
Fair
16.5%
Arabs
31.4
/100
|
#187
Fair
16.6%
Immigrants | Morocco
31.2
/100
|
#188
Fair
16.6%
Immigrants | Portugal
30.0
/100
|
#189
Fair
16.6%
Immigrants | Costa Rica
29.6
/100
|
#190
Fair
16.6%
Immigrants | Iraq
28.3
/100
|
#191
Fair
16.7%
Spanish
24.5
/100
|
#192
Fair
16.7%
Spaniards
23.2
/100
|
#193
Fair
16.8%
Immigrants | Uruguay
23.1
/100
|
#194
Fair
16.8%
Immigrants | Uganda
22.5
/100
|
#195
Fair
16.8%

Demographics Similar to Immigrants from Micronesia by Child Poverty Under the Age of 16

In terms of child poverty under the age of 16, the demographic groups most similar to Immigrants from Micronesia are Immigrants from Africa (18.0%, a difference of 0.15%), Bermudan (18.0%, a difference of 0.34%), Nonimmigrants (17.9%, a difference of 0.40%), Marshallese (18.1%, a difference of 0.73%), and Osage (17.9%, a difference of 0.77%).
DemographicsRating | RankChild Poverty Under the Age of 16
Cubans
3.7
/100
|
#221
Tragic
17.8%
Immigrants | Armenia
3.6
/100
|
#222
Tragic
17.8%
Immigrants | Cambodia
3.3
/100
|
#223
Tragic
17.8%
Osage
3.1
/100
|
#224
Tragic
17.9%
Immigrants | Nonimmigrants
2.7
/100
|
#225
Tragic
17.9%
Bermudans
2.6
/100
|
#226
Tragic
18.0%
Immigrants | Africa
2.5
/100
|
#227
Tragic
18.0%
Immigrants | Micronesia
2.3
/100
|
#228
Tragic
18.0%
Marshallese
1.8
/100
|
#229
Tragic
18.1%
Nepalese
1.7
/100
|
#230
Tragic
18.2%
Nicaraguans
1.7
/100
|
#231
Tragic
18.2%
Americans
1.2
/100
|
#232
Tragic
18.3%
Fijians
1.1
/100
|
#233
Tragic
18.4%
Immigrants | Nigeria
1.0
/100
|
#234
Tragic
18.4%
Nigerians
1.0
/100
|
#235
Tragic
18.4%