Immigrants from Morocco vs Immigrants from Micronesia Seniors Poverty Over the Age of 65
COMPARE
Immigrants from Morocco
Immigrants from Micronesia
Seniors Poverty Over the Age of 65
Seniors Poverty Over the Age of 65 Comparison
Immigrants from Morocco
Immigrants from Micronesia
11.6%
SENIORS POVERTY OVER THE AGE OF 65
6.8/ 100
METRIC RATING
216th/ 347
METRIC RANK
10.7%
SENIORS POVERTY OVER THE AGE OF 65
70.8/ 100
METRIC RATING
159th/ 347
METRIC RANK
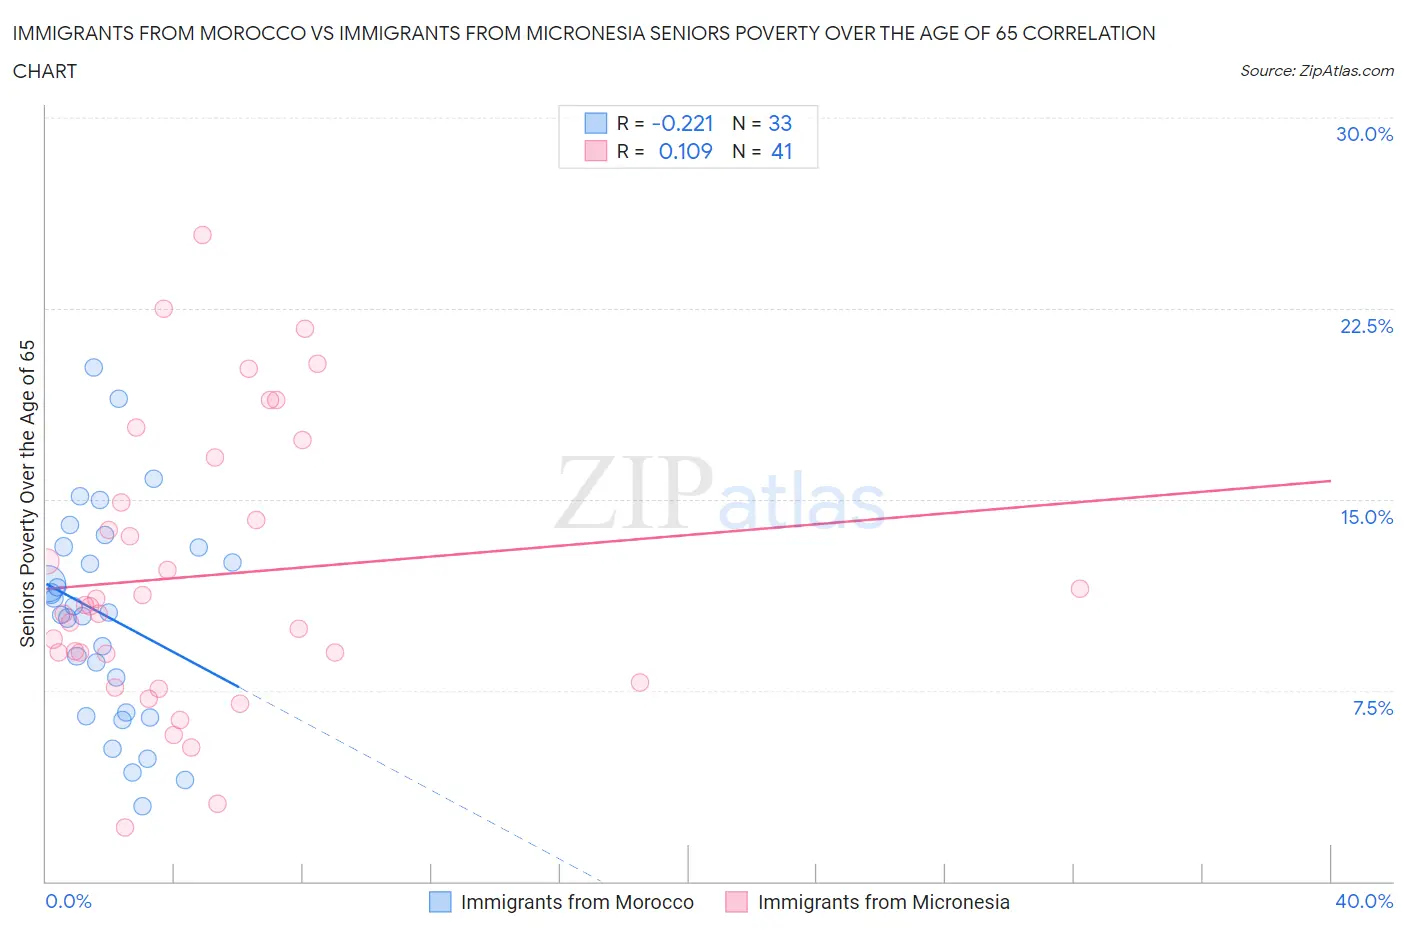
Immigrants from Morocco vs Immigrants from Micronesia Seniors Poverty Over the Age of 65 Correlation Chart
The statistical analysis conducted on geographies consisting of 178,796,340 people shows a weak negative correlation between the proportion of Immigrants from Morocco and poverty level among seniors over the age of 65 in the United States with a correlation coefficient (R) of -0.221 and weighted average of 11.6%. Similarly, the statistical analysis conducted on geographies consisting of 61,393,382 people shows a poor positive correlation between the proportion of Immigrants from Micronesia and poverty level among seniors over the age of 65 in the United States with a correlation coefficient (R) of 0.109 and weighted average of 10.7%, a difference of 7.9%.
Seniors Poverty Over the Age of 65 Correlation Summary
| Measurement | Immigrants from Morocco | Immigrants from Micronesia |
| Minimum | 2.9% | 2.1% |
| Maximum | 20.2% | 25.4% |
| Range | 17.2% | 23.3% |
| Mean | 10.4% | 12.0% |
| Median | 10.6% | 10.8% |
| Interquartile 25% (IQ1) | 6.6% | 8.4% |
| Interquartile 75% (IQ3) | 13.1% | 15.8% |
| Interquartile Range (IQR) | 6.6% | 7.4% |
| Standard Deviation (Sample) | 4.2% | 5.4% |
| Standard Deviation (Population) | 4.1% | 5.4% |
Similar Demographics by Seniors Poverty Over the Age of 65
Demographics Similar to Immigrants from Morocco by Seniors Poverty Over the Age of 65
In terms of seniors poverty over the age of 65, the demographic groups most similar to Immigrants from Morocco are Immigrants from Africa (11.6%, a difference of 0.15%), Immigrants from Ukraine (11.6%, a difference of 0.41%), French American Indian (11.5%, a difference of 0.55%), Immigrants from Russia (11.5%, a difference of 0.59%), and Arapaho (11.6%, a difference of 0.59%).
| Demographics | Rating | Rank | Seniors Poverty Over the Age of 65 |
| Paraguayans | 11.3 /100 | #209 | Poor 11.4% |
| Ugandans | 11.2 /100 | #210 | Poor 11.4% |
| Indonesians | 10.4 /100 | #211 | Poor 11.5% |
| Immigrants | China | 9.5 /100 | #212 | Tragic 11.5% |
| Nepalese | 8.9 /100 | #213 | Tragic 11.5% |
| Immigrants | Russia | 8.8 /100 | #214 | Tragic 11.5% |
| French American Indians | 8.7 /100 | #215 | Tragic 11.5% |
| Immigrants | Morocco | 6.8 /100 | #216 | Tragic 11.6% |
| Immigrants | Africa | 6.4 /100 | #217 | Tragic 11.6% |
| Immigrants | Ukraine | 5.7 /100 | #218 | Tragic 11.6% |
| Arapaho | 5.2 /100 | #219 | Tragic 11.6% |
| Peruvians | 4.2 /100 | #220 | Tragic 11.7% |
| Argentineans | 4.1 /100 | #221 | Tragic 11.7% |
| Immigrants | Chile | 3.9 /100 | #222 | Tragic 11.7% |
| Immigrants | Congo | 3.8 /100 | #223 | Tragic 11.7% |
Demographics Similar to Immigrants from Micronesia by Seniors Poverty Over the Age of 65
In terms of seniors poverty over the age of 65, the demographic groups most similar to Immigrants from Micronesia are Immigrants from Sierra Leone (10.7%, a difference of 0.10%), Ethiopian (10.7%, a difference of 0.24%), Immigrants from Ethiopia (10.7%, a difference of 0.24%), Sudanese (10.7%, a difference of 0.27%), and Chickasaw (10.7%, a difference of 0.32%).
| Demographics | Rating | Rank | Seniors Poverty Over the Age of 65 |
| Immigrants | Egypt | 76.5 /100 | #152 | Good 10.6% |
| Fijians | 75.6 /100 | #153 | Good 10.7% |
| Immigrants | Saudi Arabia | 74.9 /100 | #154 | Good 10.7% |
| Chickasaw | 73.6 /100 | #155 | Good 10.7% |
| Ethiopians | 72.9 /100 | #156 | Good 10.7% |
| Immigrants | Ethiopia | 72.9 /100 | #157 | Good 10.7% |
| Immigrants | Sierra Leone | 71.7 /100 | #158 | Good 10.7% |
| Immigrants | Micronesia | 70.8 /100 | #159 | Good 10.7% |
| Sudanese | 68.2 /100 | #160 | Good 10.7% |
| Arabs | 65.2 /100 | #161 | Good 10.8% |
| Immigrants | Indonesia | 64.8 /100 | #162 | Good 10.8% |
| Tsimshian | 64.5 /100 | #163 | Good 10.8% |
| Potawatomi | 62.6 /100 | #164 | Good 10.8% |
| Immigrants | South Eastern Asia | 62.1 /100 | #165 | Good 10.8% |
| Malaysians | 62.0 /100 | #166 | Good 10.8% |