Immigrants from Middle Africa vs Central American Indian 2nd Grade
COMPARE
Immigrants from Middle Africa
Central American Indian
2nd Grade
2nd Grade Comparison
Immigrants from Middle Africa
Central American Indians
97.5%
2ND GRADE
0.9/ 100
METRIC RATING
248th/ 347
METRIC RANK
97.0%
2ND GRADE
0.0/ 100
METRIC RATING
301st/ 347
METRIC RANK
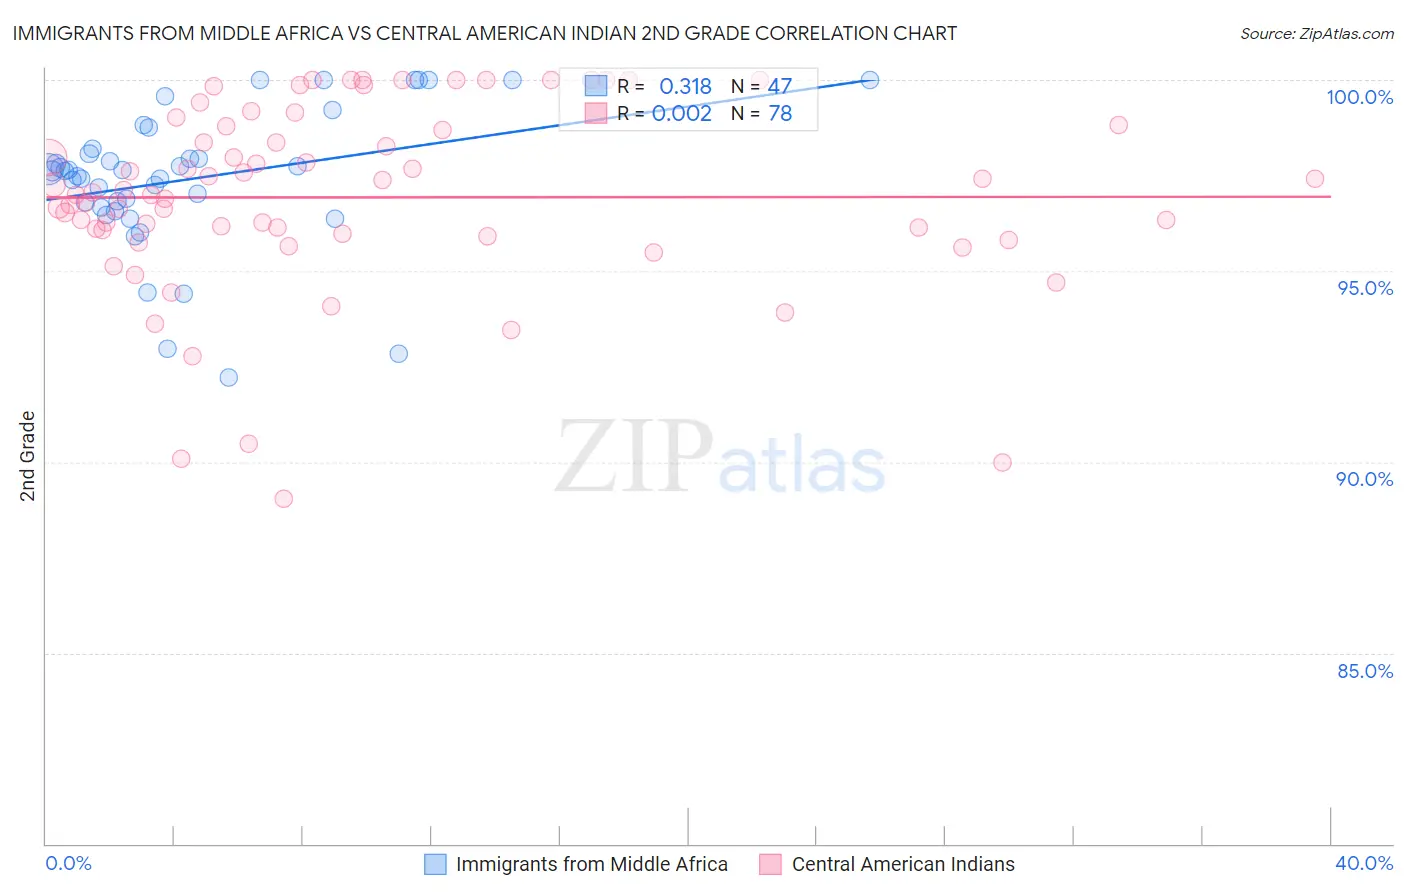
Immigrants from Middle Africa vs Central American Indian 2nd Grade Correlation Chart
The statistical analysis conducted on geographies consisting of 202,721,852 people shows a mild positive correlation between the proportion of Immigrants from Middle Africa and percentage of population with at least 2nd grade education in the United States with a correlation coefficient (R) of 0.318 and weighted average of 97.5%. Similarly, the statistical analysis conducted on geographies consisting of 326,141,205 people shows no correlation between the proportion of Central American Indians and percentage of population with at least 2nd grade education in the United States with a correlation coefficient (R) of 0.002 and weighted average of 97.0%, a difference of 0.55%.
2nd Grade Correlation Summary
| Measurement | Immigrants from Middle Africa | Central American Indian |
| Minimum | 92.2% | 89.0% |
| Maximum | 100.0% | 100.0% |
| Range | 7.8% | 11.0% |
| Mean | 97.4% | 96.9% |
| Median | 97.6% | 97.0% |
| Interquartile 25% (IQ1) | 96.7% | 96.0% |
| Interquartile 75% (IQ3) | 98.2% | 98.8% |
| Interquartile Range (IQR) | 1.6% | 2.8% |
| Standard Deviation (Sample) | 1.8% | 2.5% |
| Standard Deviation (Population) | 1.8% | 2.4% |
Similar Demographics by 2nd Grade
Demographics Similar to Immigrants from Middle Africa by 2nd Grade
In terms of 2nd grade, the demographic groups most similar to Immigrants from Middle Africa are Immigrants from Eastern Africa (97.5%, a difference of 0.0%), South American (97.5%, a difference of 0.0%), Immigrants from Senegal (97.5%, a difference of 0.0%), Bolivian (97.5%, a difference of 0.0%), and Immigrants from Iraq (97.5%, a difference of 0.010%).
| Demographics | Rating | Rank | 2nd Grade |
| Ethiopians | 1.2 /100 | #241 | Tragic 97.5% |
| Immigrants | Indonesia | 1.2 /100 | #242 | Tragic 97.5% |
| Asians | 1.1 /100 | #243 | Tragic 97.5% |
| Immigrants | Iraq | 1.0 /100 | #244 | Tragic 97.5% |
| Immigrants | Eastern Africa | 0.9 /100 | #245 | Tragic 97.5% |
| South Americans | 0.9 /100 | #246 | Tragic 97.5% |
| Immigrants | Senegal | 0.9 /100 | #247 | Tragic 97.5% |
| Immigrants | Middle Africa | 0.9 /100 | #248 | Tragic 97.5% |
| Bolivians | 0.9 /100 | #249 | Tragic 97.5% |
| Peruvians | 0.9 /100 | #250 | Tragic 97.5% |
| Immigrants | Africa | 0.8 /100 | #251 | Tragic 97.5% |
| Immigrants | Asia | 0.7 /100 | #252 | Tragic 97.5% |
| Puerto Ricans | 0.7 /100 | #253 | Tragic 97.5% |
| Indians (Asian) | 0.6 /100 | #254 | Tragic 97.5% |
| Immigrants | Congo | 0.6 /100 | #255 | Tragic 97.5% |
Demographics Similar to Central American Indians by 2nd Grade
In terms of 2nd grade, the demographic groups most similar to Central American Indians are Immigrants from South Eastern Asia (97.0%, a difference of 0.020%), Somali (97.0%, a difference of 0.020%), Immigrants from Cuba (97.0%, a difference of 0.040%), Immigrants from Dominica (97.0%, a difference of 0.040%), and Haitian (97.0%, a difference of 0.040%).
| Demographics | Rating | Rank | 2nd Grade |
| Malaysians | 0.0 /100 | #294 | Tragic 97.1% |
| Immigrants | Grenada | 0.0 /100 | #295 | Tragic 97.1% |
| Immigrants | Immigrants | 0.0 /100 | #296 | Tragic 97.1% |
| Immigrants | Cuba | 0.0 /100 | #297 | Tragic 97.0% |
| Immigrants | Dominica | 0.0 /100 | #298 | Tragic 97.0% |
| Haitians | 0.0 /100 | #299 | Tragic 97.0% |
| Immigrants | South Eastern Asia | 0.0 /100 | #300 | Tragic 97.0% |
| Central American Indians | 0.0 /100 | #301 | Tragic 97.0% |
| Somalis | 0.0 /100 | #302 | Tragic 97.0% |
| Ecuadorians | 0.0 /100 | #303 | Tragic 96.9% |
| Immigrants | Caribbean | 0.0 /100 | #304 | Tragic 96.9% |
| Nicaraguans | 0.0 /100 | #305 | Tragic 96.9% |
| Immigrants | Somalia | 0.0 /100 | #306 | Tragic 96.9% |
| Immigrants | Azores | 0.0 /100 | #307 | Tragic 96.8% |
| Immigrants | Haiti | 0.0 /100 | #308 | Tragic 96.8% |