Immigrants from Micronesia vs Immigrants from Eastern Europe Female Poverty Among 25-34 Year Olds
COMPARE
Immigrants from Micronesia
Immigrants from Eastern Europe
Female Poverty Among 25-34 Year Olds
Female Poverty Among 25-34 Year Olds Comparison
Immigrants from Micronesia
Immigrants from Eastern Europe
15.8%
FEMALE POVERTY AMONG 25-34 YEAR OLDS
0.0/ 100
METRIC RATING
277th/ 347
METRIC RANK
12.0%
FEMALE POVERTY AMONG 25-34 YEAR OLDS
99.6/ 100
METRIC RATING
52nd/ 347
METRIC RANK
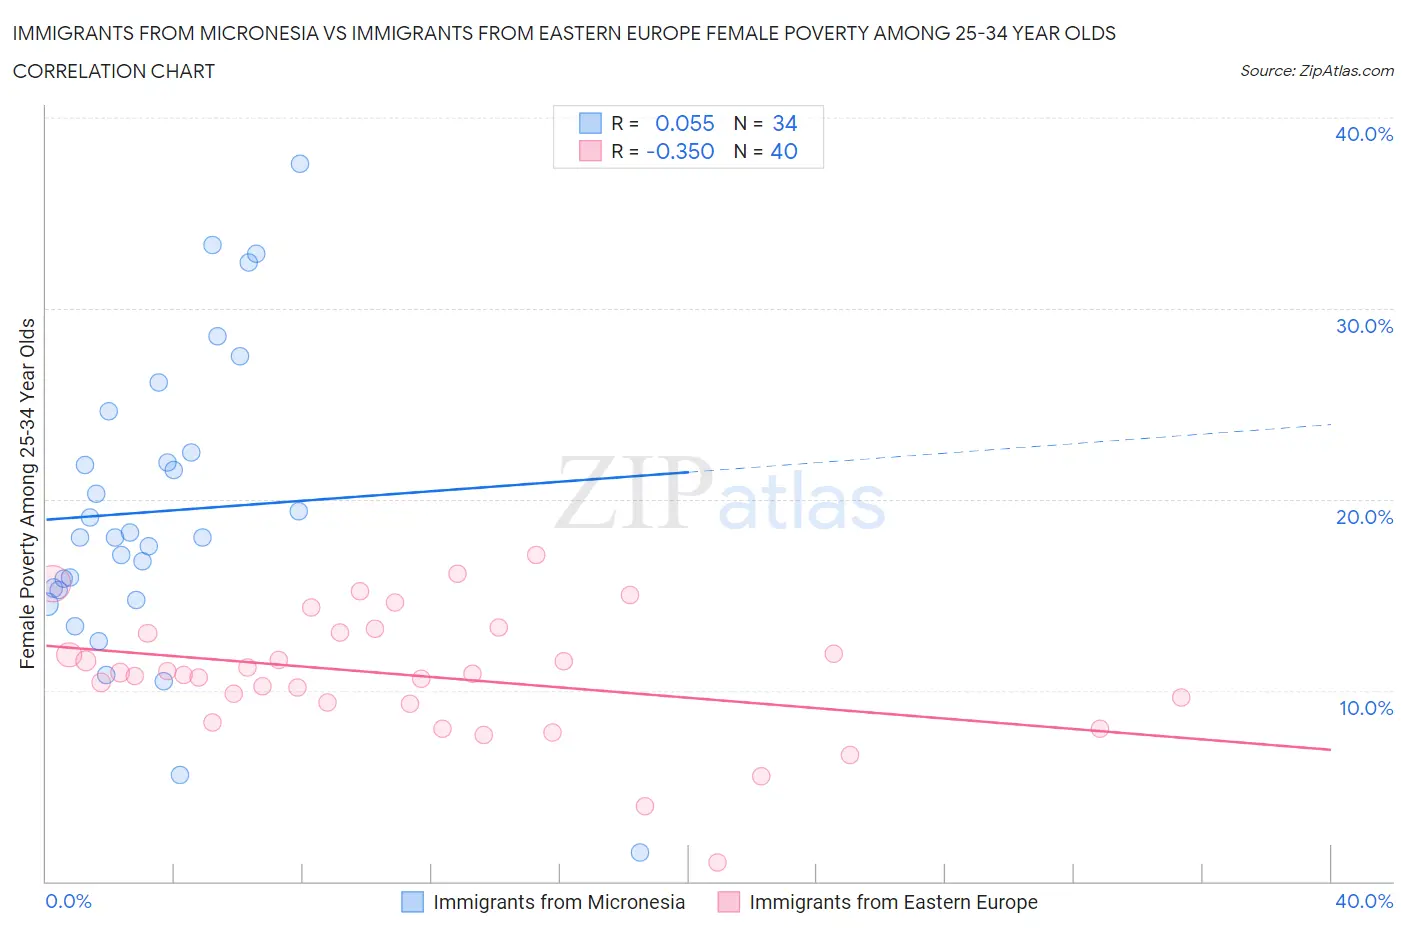
Immigrants from Micronesia vs Immigrants from Eastern Europe Female Poverty Among 25-34 Year Olds Correlation Chart
The statistical analysis conducted on geographies consisting of 61,523,063 people shows a slight positive correlation between the proportion of Immigrants from Micronesia and poverty level among females between the ages 25 and 34 in the United States with a correlation coefficient (R) of 0.055 and weighted average of 15.8%. Similarly, the statistical analysis conducted on geographies consisting of 463,335,810 people shows a mild negative correlation between the proportion of Immigrants from Eastern Europe and poverty level among females between the ages 25 and 34 in the United States with a correlation coefficient (R) of -0.350 and weighted average of 12.0%, a difference of 32.2%.
Female Poverty Among 25-34 Year Olds Correlation Summary
| Measurement | Immigrants from Micronesia | Immigrants from Eastern Europe |
| Minimum | 1.5% | 0.98% |
| Maximum | 37.5% | 17.1% |
| Range | 36.0% | 16.1% |
| Mean | 19.4% | 10.8% |
| Median | 18.0% | 10.8% |
| Interquartile 25% (IQ1) | 15.2% | 9.3% |
| Interquartile 75% (IQ3) | 22.4% | 13.0% |
| Interquartile Range (IQR) | 7.2% | 3.7% |
| Standard Deviation (Sample) | 7.8% | 3.3% |
| Standard Deviation (Population) | 7.7% | 3.2% |
Similar Demographics by Female Poverty Among 25-34 Year Olds
Demographics Similar to Immigrants from Micronesia by Female Poverty Among 25-34 Year Olds
In terms of female poverty among 25-34 year olds, the demographic groups most similar to Immigrants from Micronesia are Immigrants from Zaire (15.8%, a difference of 0.010%), French American Indian (15.9%, a difference of 0.29%), Fijian (15.9%, a difference of 0.29%), Immigrants from the Azores (15.8%, a difference of 0.44%), and Bangladeshi (15.9%, a difference of 0.45%).
| Demographics | Rating | Rank | Female Poverty Among 25-34 Year Olds |
| British West Indians | 0.1 /100 | #270 | Tragic 15.6% |
| Cree | 0.1 /100 | #271 | Tragic 15.6% |
| Senegalese | 0.1 /100 | #272 | Tragic 15.6% |
| Immigrants | Nonimmigrants | 0.1 /100 | #273 | Tragic 15.6% |
| Immigrants | Caribbean | 0.0 /100 | #274 | Tragic 15.7% |
| Immigrants | Azores | 0.0 /100 | #275 | Tragic 15.8% |
| Immigrants | Zaire | 0.0 /100 | #276 | Tragic 15.8% |
| Immigrants | Micronesia | 0.0 /100 | #277 | Tragic 15.8% |
| French American Indians | 0.0 /100 | #278 | Tragic 15.9% |
| Fijians | 0.0 /100 | #279 | Tragic 15.9% |
| Bangladeshis | 0.0 /100 | #280 | Tragic 15.9% |
| Immigrants | Latin America | 0.0 /100 | #281 | Tragic 16.0% |
| Aleuts | 0.0 /100 | #282 | Tragic 16.1% |
| Bahamians | 0.0 /100 | #283 | Tragic 16.1% |
| Shoshone | 0.0 /100 | #284 | Tragic 16.2% |
Demographics Similar to Immigrants from Eastern Europe by Female Poverty Among 25-34 Year Olds
In terms of female poverty among 25-34 year olds, the demographic groups most similar to Immigrants from Eastern Europe are Paraguayan (12.0%, a difference of 0.020%), Immigrants from Croatia (12.0%, a difference of 0.030%), Immigrants from Egypt (12.0%, a difference of 0.040%), Immigrants from Belarus (12.0%, a difference of 0.12%), and Immigrants from Israel (12.0%, a difference of 0.12%).
| Demographics | Rating | Rank | Female Poverty Among 25-34 Year Olds |
| Macedonians | 99.7 /100 | #45 | Exceptional 11.9% |
| Immigrants | Serbia | 99.7 /100 | #46 | Exceptional 11.9% |
| Koreans | 99.6 /100 | #47 | Exceptional 12.0% |
| Immigrants | Belarus | 99.6 /100 | #48 | Exceptional 12.0% |
| Immigrants | Egypt | 99.6 /100 | #49 | Exceptional 12.0% |
| Immigrants | Croatia | 99.6 /100 | #50 | Exceptional 12.0% |
| Paraguayans | 99.6 /100 | #51 | Exceptional 12.0% |
| Immigrants | Eastern Europe | 99.6 /100 | #52 | Exceptional 12.0% |
| Immigrants | Israel | 99.6 /100 | #53 | Exceptional 12.0% |
| Eastern Europeans | 99.6 /100 | #54 | Exceptional 12.0% |
| Immigrants | Philippines | 99.5 /100 | #55 | Exceptional 12.0% |
| Luxembourgers | 99.5 /100 | #56 | Exceptional 12.1% |
| Jordanians | 99.4 /100 | #57 | Exceptional 12.1% |
| Immigrants | Romania | 99.4 /100 | #58 | Exceptional 12.1% |
| Russians | 99.4 /100 | #59 | Exceptional 12.1% |