Immigrants from Micronesia vs Immigrants from Eastern Europe 10th Grade
COMPARE
Immigrants from Micronesia
Immigrants from Eastern Europe
10th Grade
10th Grade Comparison
Immigrants from Micronesia
Immigrants from Eastern Europe
93.5%
10TH GRADE
23.2/ 100
METRIC RATING
198th/ 347
METRIC RANK
94.3%
10TH GRADE
92.5/ 100
METRIC RATING
131st/ 347
METRIC RANK
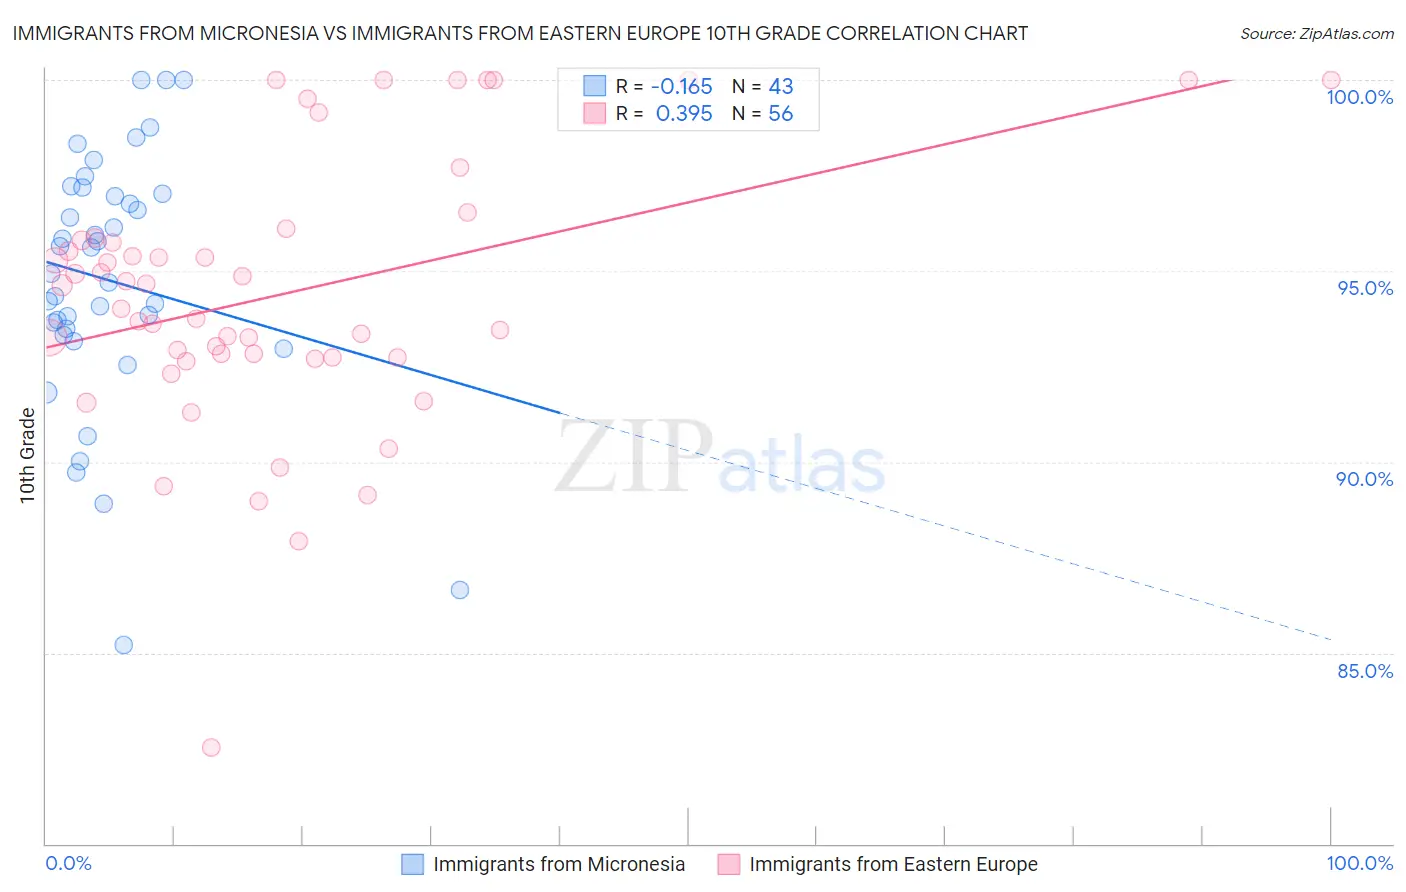
Immigrants from Micronesia vs Immigrants from Eastern Europe 10th Grade Correlation Chart
The statistical analysis conducted on geographies consisting of 61,604,657 people shows a poor negative correlation between the proportion of Immigrants from Micronesia and percentage of population with at least 10th grade education in the United States with a correlation coefficient (R) of -0.165 and weighted average of 93.5%. Similarly, the statistical analysis conducted on geographies consisting of 475,879,420 people shows a mild positive correlation between the proportion of Immigrants from Eastern Europe and percentage of population with at least 10th grade education in the United States with a correlation coefficient (R) of 0.395 and weighted average of 94.3%, a difference of 0.83%.
10th Grade Correlation Summary
| Measurement | Immigrants from Micronesia | Immigrants from Eastern Europe |
| Minimum | 85.2% | 82.5% |
| Maximum | 100.0% | 100.0% |
| Range | 14.8% | 17.5% |
| Mean | 94.7% | 94.4% |
| Median | 94.9% | 94.3% |
| Interquartile 25% (IQ1) | 93.3% | 92.7% |
| Interquartile 75% (IQ3) | 97.0% | 95.8% |
| Interquartile Range (IQR) | 3.7% | 3.1% |
| Standard Deviation (Sample) | 3.3% | 3.5% |
| Standard Deviation (Population) | 3.3% | 3.5% |
Similar Demographics by 10th Grade
Demographics Similar to Immigrants from Micronesia by 10th Grade
In terms of 10th grade, the demographic groups most similar to Immigrants from Micronesia are Asian (93.5%, a difference of 0.0%), Pueblo (93.5%, a difference of 0.010%), Hopi (93.5%, a difference of 0.010%), Hawaiian (93.5%, a difference of 0.020%), and Moroccan (93.5%, a difference of 0.030%).
| Demographics | Rating | Rank | 10th Grade |
| Yup'ik | 31.1 /100 | #191 | Fair 93.6% |
| Immigrants | Malaysia | 28.0 /100 | #192 | Fair 93.5% |
| Panamanians | 28.0 /100 | #193 | Fair 93.5% |
| Immigrants | Morocco | 26.9 /100 | #194 | Fair 93.5% |
| Cheyenne | 26.8 /100 | #195 | Fair 93.5% |
| Moroccans | 25.3 /100 | #196 | Fair 93.5% |
| Pueblo | 23.9 /100 | #197 | Fair 93.5% |
| Immigrants | Micronesia | 23.2 /100 | #198 | Fair 93.5% |
| Asians | 23.0 /100 | #199 | Fair 93.5% |
| Hopi | 22.2 /100 | #200 | Fair 93.5% |
| Hawaiians | 21.8 /100 | #201 | Fair 93.5% |
| Immigrants | Uganda | 20.9 /100 | #202 | Fair 93.5% |
| Immigrants | Western Asia | 20.6 /100 | #203 | Fair 93.4% |
| Ute | 20.3 /100 | #204 | Fair 93.4% |
| Immigrants | Indonesia | 20.2 /100 | #205 | Fair 93.4% |
Demographics Similar to Immigrants from Eastern Europe by 10th Grade
In terms of 10th grade, the demographic groups most similar to Immigrants from Eastern Europe are Iroquois (94.3%, a difference of 0.010%), Immigrants from Greece (94.3%, a difference of 0.010%), Immigrants from Russia (94.3%, a difference of 0.010%), Creek (94.2%, a difference of 0.020%), and Osage (94.2%, a difference of 0.030%).
| Demographics | Rating | Rank | 10th Grade |
| Basques | 94.9 /100 | #124 | Exceptional 94.3% |
| Americans | 94.4 /100 | #125 | Exceptional 94.3% |
| Immigrants | Iran | 94.4 /100 | #126 | Exceptional 94.3% |
| Israelis | 93.8 /100 | #127 | Exceptional 94.3% |
| Potawatomi | 93.6 /100 | #128 | Exceptional 94.3% |
| Iroquois | 92.8 /100 | #129 | Exceptional 94.3% |
| Immigrants | Greece | 92.7 /100 | #130 | Exceptional 94.3% |
| Immigrants | Eastern Europe | 92.5 /100 | #131 | Exceptional 94.3% |
| Immigrants | Russia | 92.4 /100 | #132 | Exceptional 94.3% |
| Creek | 91.9 /100 | #133 | Exceptional 94.2% |
| Osage | 91.7 /100 | #134 | Exceptional 94.2% |
| Immigrants | Korea | 91.3 /100 | #135 | Exceptional 94.2% |
| Shoshone | 90.8 /100 | #136 | Exceptional 94.2% |
| Arapaho | 90.5 /100 | #137 | Exceptional 94.2% |
| Immigrants | Sri Lanka | 89.9 /100 | #138 | Excellent 94.2% |