Potawatomi vs Immigrants from Eastern Europe 4 or more Vehicles in Household
COMPARE
Potawatomi
Immigrants from Eastern Europe
4 or more Vehicles in Household
4 or more Vehicles in Household Comparison
Potawatomi
Immigrants from Eastern Europe
7.3%
4 OR MORE VEHICLES IN HOUSEHOLD
99.7/ 100
METRIC RATING
83rd/ 347
METRIC RANK
5.4%
4 OR MORE VEHICLES IN HOUSEHOLD
0.4/ 100
METRIC RATING
278th/ 347
METRIC RANK
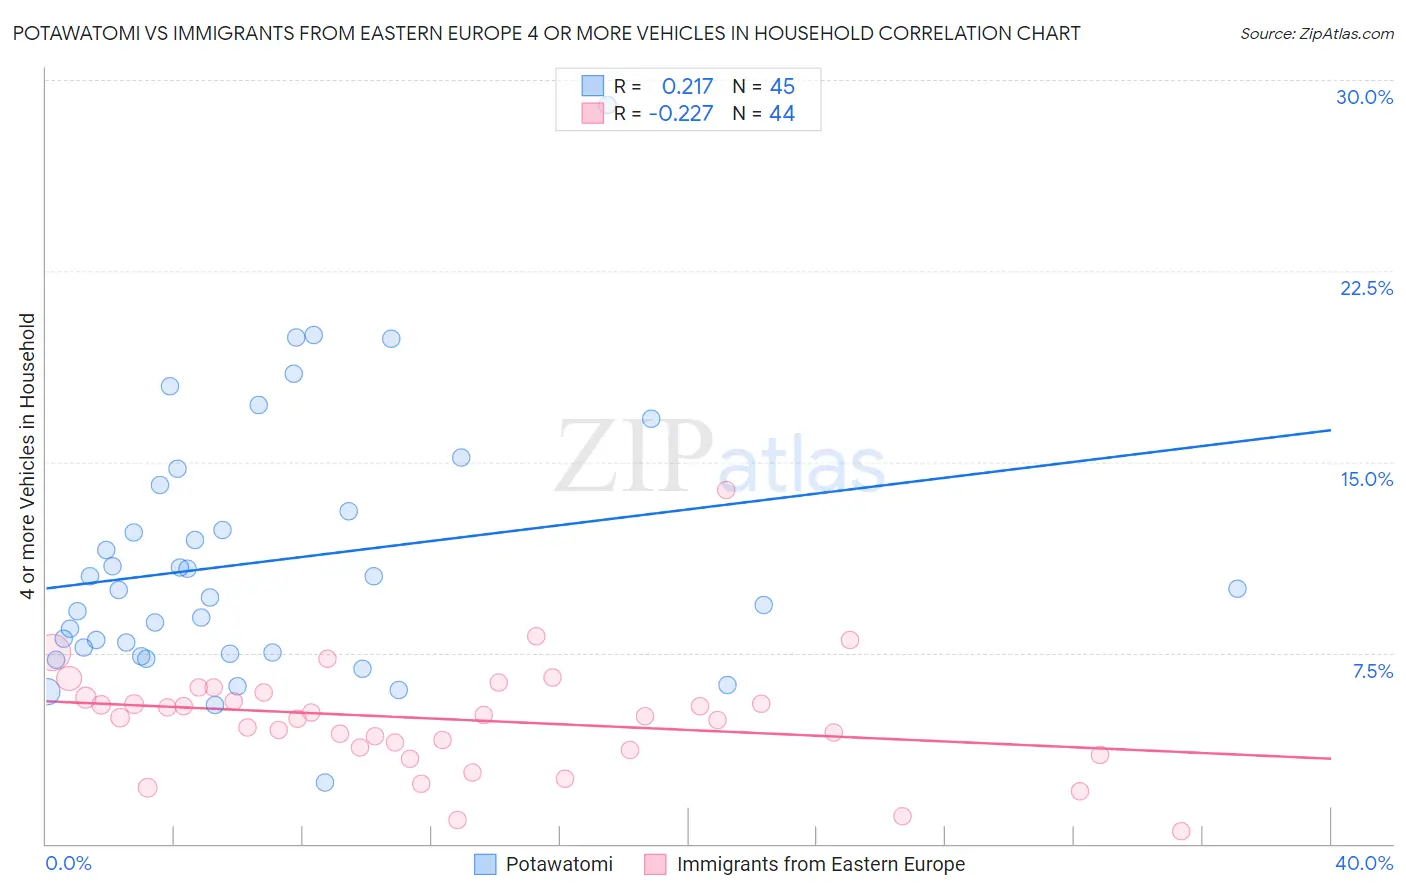
Potawatomi vs Immigrants from Eastern Europe 4 or more Vehicles in Household Correlation Chart
The statistical analysis conducted on geographies consisting of 117,653,043 people shows a weak positive correlation between the proportion of Potawatomi and percentage of households with 4 or more vehicles available in the United States with a correlation coefficient (R) of 0.217 and weighted average of 7.3%. Similarly, the statistical analysis conducted on geographies consisting of 473,333,841 people shows a weak negative correlation between the proportion of Immigrants from Eastern Europe and percentage of households with 4 or more vehicles available in the United States with a correlation coefficient (R) of -0.227 and weighted average of 5.4%, a difference of 33.9%.
4 or more Vehicles in Household Correlation Summary
| Measurement | Potawatomi | Immigrants from Eastern Europe |
| Minimum | 2.4% | 0.50% |
| Maximum | 29.0% | 13.9% |
| Range | 26.6% | 13.4% |
| Mean | 11.1% | 4.9% |
| Median | 10.0% | 5.0% |
| Interquartile 25% (IQ1) | 7.5% | 3.7% |
| Interquartile 75% (IQ3) | 13.6% | 5.8% |
| Interquartile Range (IQR) | 6.1% | 2.1% |
| Standard Deviation (Sample) | 5.1% | 2.3% |
| Standard Deviation (Population) | 5.0% | 2.2% |
Similar Demographics by 4 or more Vehicles in Household
Demographics Similar to Potawatomi by 4 or more Vehicles in Household
In terms of 4 or more vehicles in household, the demographic groups most similar to Potawatomi are Northern European (7.3%, a difference of 0.12%), Finnish (7.3%, a difference of 0.32%), Afghan (7.3%, a difference of 0.33%), Cree (7.2%, a difference of 0.49%), and Immigrants from Indonesia (7.2%, a difference of 0.68%).
| Demographics | Rating | Rank | 4 or more Vehicles in Household |
| Laotians | 99.9 /100 | #76 | Exceptional 7.4% |
| Apache | 99.9 /100 | #77 | Exceptional 7.4% |
| Whites/Caucasians | 99.8 /100 | #78 | Exceptional 7.4% |
| Czechs | 99.8 /100 | #79 | Exceptional 7.4% |
| Alaska Natives | 99.8 /100 | #80 | Exceptional 7.3% |
| Finns | 99.8 /100 | #81 | Exceptional 7.3% |
| Northern Europeans | 99.8 /100 | #82 | Exceptional 7.3% |
| Potawatomi | 99.7 /100 | #83 | Exceptional 7.3% |
| Afghans | 99.7 /100 | #84 | Exceptional 7.3% |
| Cree | 99.7 /100 | #85 | Exceptional 7.2% |
| Immigrants | Indonesia | 99.6 /100 | #86 | Exceptional 7.2% |
| Delaware | 99.6 /100 | #87 | Exceptional 7.2% |
| Immigrants | Nonimmigrants | 99.6 /100 | #88 | Exceptional 7.2% |
| British | 99.6 /100 | #89 | Exceptional 7.2% |
| Creek | 99.6 /100 | #90 | Exceptional 7.2% |
Demographics Similar to Immigrants from Eastern Europe by 4 or more Vehicles in Household
In terms of 4 or more vehicles in household, the demographic groups most similar to Immigrants from Eastern Europe are Immigrants from Uruguay (5.4%, a difference of 0.46%), Alsatian (5.4%, a difference of 0.47%), Immigrants from Western Africa (5.4%, a difference of 0.54%), Immigrants from Spain (5.4%, a difference of 0.71%), and Immigrants from Ireland (5.4%, a difference of 0.79%).
| Demographics | Rating | Rank | 4 or more Vehicles in Household |
| Immigrants | Sudan | 0.6 /100 | #271 | Tragic 5.5% |
| Immigrants | Kazakhstan | 0.6 /100 | #272 | Tragic 5.5% |
| Macedonians | 0.6 /100 | #273 | Tragic 5.5% |
| Blacks/African Americans | 0.6 /100 | #274 | Tragic 5.5% |
| Cambodians | 0.5 /100 | #275 | Tragic 5.5% |
| Immigrants | Latvia | 0.5 /100 | #276 | Tragic 5.5% |
| Immigrants | Bulgaria | 0.5 /100 | #277 | Tragic 5.5% |
| Immigrants | Eastern Europe | 0.4 /100 | #278 | Tragic 5.4% |
| Immigrants | Uruguay | 0.3 /100 | #279 | Tragic 5.4% |
| Alsatians | 0.3 /100 | #280 | Tragic 5.4% |
| Immigrants | Western Africa | 0.3 /100 | #281 | Tragic 5.4% |
| Immigrants | Spain | 0.3 /100 | #282 | Tragic 5.4% |
| Immigrants | Ireland | 0.3 /100 | #283 | Tragic 5.4% |
| Brazilians | 0.3 /100 | #284 | Tragic 5.4% |
| Immigrants | Liberia | 0.2 /100 | #285 | Tragic 5.4% |