Immigrants from Korea vs Soviet Union 4 or more Vehicles in Household
COMPARE
Immigrants from Korea
Soviet Union
4 or more Vehicles in Household
4 or more Vehicles in Household Comparison
Immigrants from Korea
Soviet Union
6.8%
4 OR MORE VEHICLES IN HOUSEHOLD
93.8/ 100
METRIC RATING
127th/ 347
METRIC RANK
4.4%
4 OR MORE VEHICLES IN HOUSEHOLD
0.0/ 100
METRIC RATING
324th/ 347
METRIC RANK
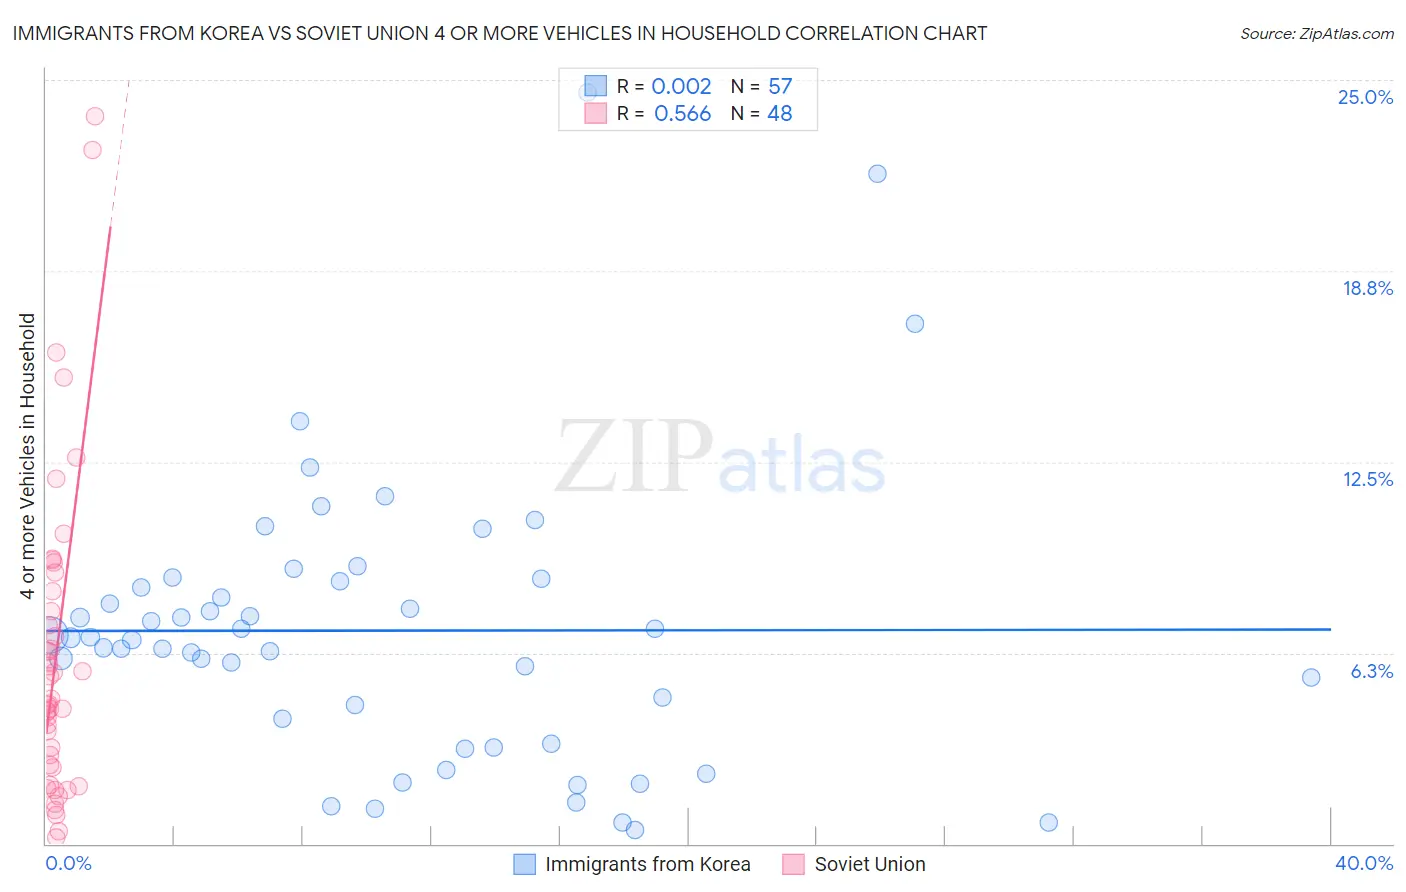
Immigrants from Korea vs Soviet Union 4 or more Vehicles in Household Correlation Chart
The statistical analysis conducted on geographies consisting of 414,077,591 people shows no correlation between the proportion of Immigrants from Korea and percentage of households with 4 or more vehicles available in the United States with a correlation coefficient (R) of 0.002 and weighted average of 6.8%. Similarly, the statistical analysis conducted on geographies consisting of 43,372,100 people shows a substantial positive correlation between the proportion of Soviet Union and percentage of households with 4 or more vehicles available in the United States with a correlation coefficient (R) of 0.566 and weighted average of 4.4%, a difference of 52.7%.
4 or more Vehicles in Household Correlation Summary
| Measurement | Immigrants from Korea | Soviet Union |
| Minimum | 0.44% | 0.22% |
| Maximum | 24.6% | 23.8% |
| Range | 24.1% | 23.6% |
| Mean | 7.0% | 6.2% |
| Median | 6.7% | 4.7% |
| Interquartile 25% (IQ1) | 3.7% | 2.6% |
| Interquartile 75% (IQ3) | 8.6% | 7.9% |
| Interquartile Range (IQR) | 5.0% | 5.4% |
| Standard Deviation (Sample) | 4.7% | 5.1% |
| Standard Deviation (Population) | 4.6% | 5.1% |
Similar Demographics by 4 or more Vehicles in Household
Demographics Similar to Immigrants from Korea by 4 or more Vehicles in Household
In terms of 4 or more vehicles in household, the demographic groups most similar to Immigrants from Korea are Belgian (6.8%, a difference of 0.12%), Austrian (6.8%, a difference of 0.13%), Immigrants from Asia (6.8%, a difference of 0.23%), Immigrants (6.8%, a difference of 0.33%), and Immigrants from Germany (6.8%, a difference of 0.39%).
| Demographics | Rating | Rank | 4 or more Vehicles in Household |
| Comanche | 94.8 /100 | #120 | Exceptional 6.8% |
| Immigrants | Germany | 94.7 /100 | #121 | Exceptional 6.8% |
| Immigrants | Nicaragua | 94.7 /100 | #122 | Exceptional 6.8% |
| Immigrants | Immigrants | 94.6 /100 | #123 | Exceptional 6.8% |
| Immigrants | Asia | 94.4 /100 | #124 | Exceptional 6.8% |
| Austrians | 94.1 /100 | #125 | Exceptional 6.8% |
| Belgians | 94.1 /100 | #126 | Exceptional 6.8% |
| Immigrants | Korea | 93.8 /100 | #127 | Exceptional 6.8% |
| Immigrants | Bolivia | 92.5 /100 | #128 | Exceptional 6.7% |
| Immigrants | England | 92.0 /100 | #129 | Exceptional 6.7% |
| Immigrants | Scotland | 89.0 /100 | #130 | Excellent 6.7% |
| Maltese | 88.4 /100 | #131 | Excellent 6.7% |
| Immigrants | Netherlands | 87.8 /100 | #132 | Excellent 6.6% |
| Armenians | 86.9 /100 | #133 | Excellent 6.6% |
| Ottawa | 86.9 /100 | #134 | Excellent 6.6% |
Demographics Similar to Soviet Union by 4 or more Vehicles in Household
In terms of 4 or more vehicles in household, the demographic groups most similar to Soviet Union are Immigrants from Caribbean (4.4%, a difference of 0.28%), Immigrants from Jamaica (4.4%, a difference of 0.32%), Cape Verdean (4.4%, a difference of 0.64%), Immigrants from Yemen (4.5%, a difference of 0.69%), and Ecuadorian (4.5%, a difference of 0.86%).
| Demographics | Rating | Rank | 4 or more Vehicles in Household |
| U.S. Virgin Islanders | 0.0 /100 | #317 | Tragic 4.6% |
| Jamaicans | 0.0 /100 | #318 | Tragic 4.6% |
| Haitians | 0.0 /100 | #319 | Tragic 4.6% |
| Immigrants | Haiti | 0.0 /100 | #320 | Tragic 4.5% |
| Ecuadorians | 0.0 /100 | #321 | Tragic 4.5% |
| Immigrants | Yemen | 0.0 /100 | #322 | Tragic 4.5% |
| Immigrants | Caribbean | 0.0 /100 | #323 | Tragic 4.4% |
| Soviet Union | 0.0 /100 | #324 | Tragic 4.4% |
| Immigrants | Jamaica | 0.0 /100 | #325 | Tragic 4.4% |
| Cape Verdeans | 0.0 /100 | #326 | Tragic 4.4% |
| Senegalese | 0.0 /100 | #327 | Tragic 4.3% |
| Trinidadians and Tobagonians | 0.0 /100 | #328 | Tragic 4.3% |
| Immigrants | Senegal | 0.0 /100 | #329 | Tragic 4.2% |
| Immigrants | Ecuador | 0.0 /100 | #330 | Tragic 4.2% |
| West Indians | 0.0 /100 | #331 | Tragic 4.2% |