Nonimmigrants vs Soviet Union 4 or more Vehicles in Household
COMPARE
Nonimmigrants
Soviet Union
4 or more Vehicles in Household
4 or more Vehicles in Household Comparison
Nonimmigrants
Soviet Union
7.2%
4 OR MORE VEHICLES IN HOUSEHOLD
99.6/ 100
METRIC RATING
88th/ 347
METRIC RANK
4.4%
4 OR MORE VEHICLES IN HOUSEHOLD
0.0/ 100
METRIC RATING
324th/ 347
METRIC RANK
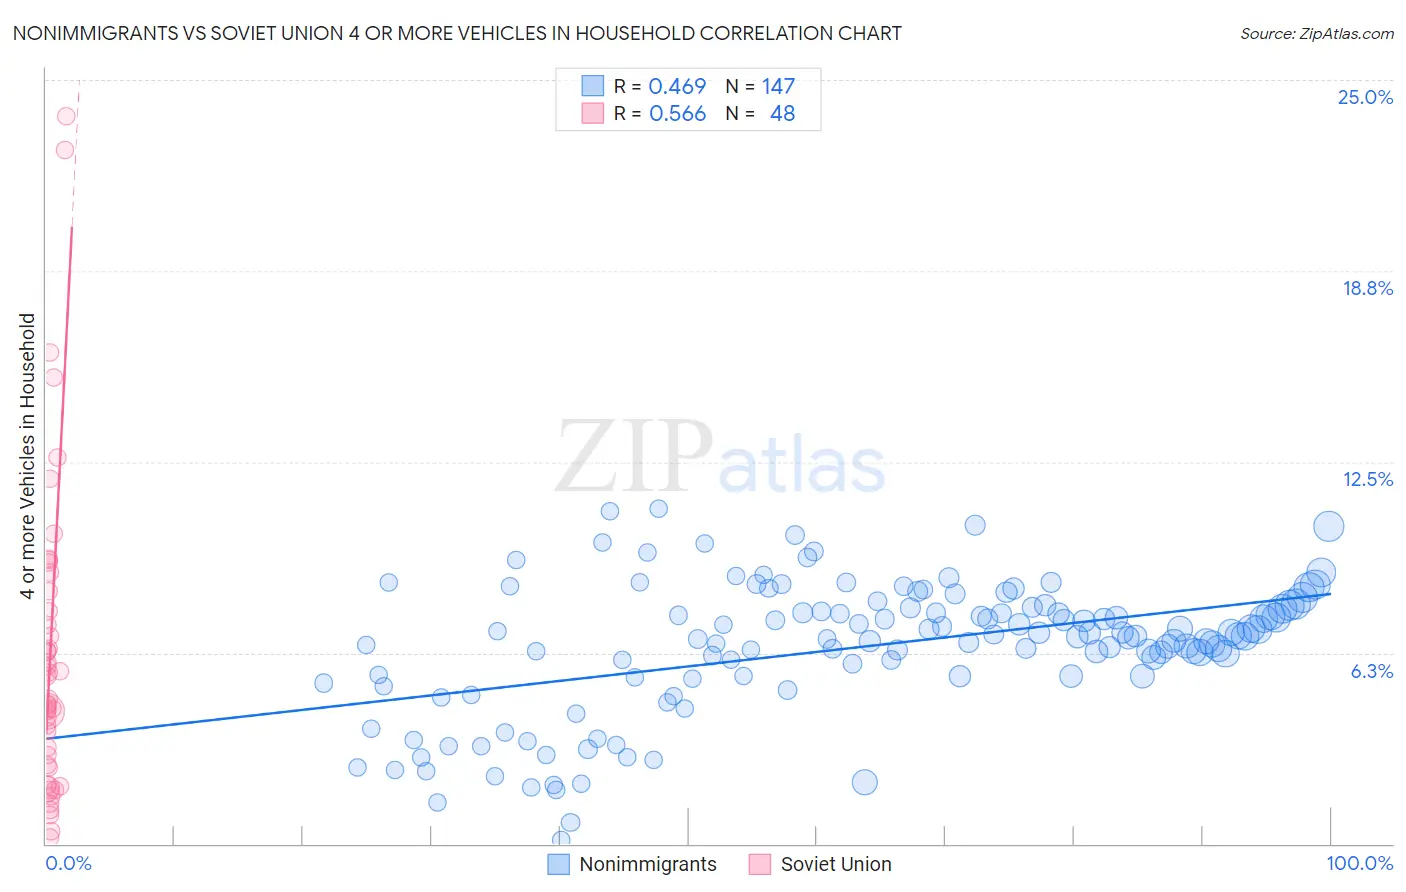
Nonimmigrants vs Soviet Union 4 or more Vehicles in Household Correlation Chart
The statistical analysis conducted on geographies consisting of 580,369,833 people shows a moderate positive correlation between the proportion of Nonimmigrants and percentage of households with 4 or more vehicles available in the United States with a correlation coefficient (R) of 0.469 and weighted average of 7.2%. Similarly, the statistical analysis conducted on geographies consisting of 43,372,100 people shows a substantial positive correlation between the proportion of Soviet Union and percentage of households with 4 or more vehicles available in the United States with a correlation coefficient (R) of 0.566 and weighted average of 4.4%, a difference of 63.2%.
4 or more Vehicles in Household Correlation Summary
| Measurement | Nonimmigrants | Soviet Union |
| Minimum | 0.13% | 0.22% |
| Maximum | 11.0% | 23.8% |
| Range | 10.9% | 23.6% |
| Mean | 6.4% | 6.2% |
| Median | 6.8% | 4.7% |
| Interquartile 25% (IQ1) | 5.5% | 2.6% |
| Interquartile 75% (IQ3) | 7.7% | 7.9% |
| Interquartile Range (IQR) | 2.3% | 5.4% |
| Standard Deviation (Sample) | 2.2% | 5.1% |
| Standard Deviation (Population) | 2.2% | 5.1% |
Similar Demographics by 4 or more Vehicles in Household
Demographics Similar to Nonimmigrants by 4 or more Vehicles in Household
In terms of 4 or more vehicles in household, the demographic groups most similar to Nonimmigrants are Delaware (7.2%, a difference of 0.020%), Immigrants from Indonesia (7.2%, a difference of 0.080%), Cree (7.2%, a difference of 0.26%), British (7.2%, a difference of 0.33%), and Creek (7.2%, a difference of 0.41%).
| Demographics | Rating | Rank | 4 or more Vehicles in Household |
| Finns | 99.8 /100 | #81 | Exceptional 7.3% |
| Northern Europeans | 99.8 /100 | #82 | Exceptional 7.3% |
| Potawatomi | 99.7 /100 | #83 | Exceptional 7.3% |
| Afghans | 99.7 /100 | #84 | Exceptional 7.3% |
| Cree | 99.7 /100 | #85 | Exceptional 7.2% |
| Immigrants | Indonesia | 99.6 /100 | #86 | Exceptional 7.2% |
| Delaware | 99.6 /100 | #87 | Exceptional 7.2% |
| Immigrants | Nonimmigrants | 99.6 /100 | #88 | Exceptional 7.2% |
| British | 99.6 /100 | #89 | Exceptional 7.2% |
| Creek | 99.6 /100 | #90 | Exceptional 7.2% |
| Assyrians/Chaldeans/Syriacs | 99.4 /100 | #91 | Exceptional 7.2% |
| Immigrants | Latin America | 99.4 /100 | #92 | Exceptional 7.1% |
| Immigrants | Afghanistan | 99.3 /100 | #93 | Exceptional 7.1% |
| Dutch West Indians | 99.3 /100 | #94 | Exceptional 7.1% |
| Czechoslovakians | 99.3 /100 | #95 | Exceptional 7.1% |
Demographics Similar to Soviet Union by 4 or more Vehicles in Household
In terms of 4 or more vehicles in household, the demographic groups most similar to Soviet Union are Immigrants from Caribbean (4.4%, a difference of 0.28%), Immigrants from Jamaica (4.4%, a difference of 0.32%), Cape Verdean (4.4%, a difference of 0.64%), Immigrants from Yemen (4.5%, a difference of 0.69%), and Ecuadorian (4.5%, a difference of 0.86%).
| Demographics | Rating | Rank | 4 or more Vehicles in Household |
| U.S. Virgin Islanders | 0.0 /100 | #317 | Tragic 4.6% |
| Jamaicans | 0.0 /100 | #318 | Tragic 4.6% |
| Haitians | 0.0 /100 | #319 | Tragic 4.6% |
| Immigrants | Haiti | 0.0 /100 | #320 | Tragic 4.5% |
| Ecuadorians | 0.0 /100 | #321 | Tragic 4.5% |
| Immigrants | Yemen | 0.0 /100 | #322 | Tragic 4.5% |
| Immigrants | Caribbean | 0.0 /100 | #323 | Tragic 4.4% |
| Soviet Union | 0.0 /100 | #324 | Tragic 4.4% |
| Immigrants | Jamaica | 0.0 /100 | #325 | Tragic 4.4% |
| Cape Verdeans | 0.0 /100 | #326 | Tragic 4.4% |
| Senegalese | 0.0 /100 | #327 | Tragic 4.3% |
| Trinidadians and Tobagonians | 0.0 /100 | #328 | Tragic 4.3% |
| Immigrants | Senegal | 0.0 /100 | #329 | Tragic 4.2% |
| Immigrants | Ecuador | 0.0 /100 | #330 | Tragic 4.2% |
| West Indians | 0.0 /100 | #331 | Tragic 4.2% |