Immigrants from Romania vs Soviet Union 4 or more Vehicles in Household
COMPARE
Immigrants from Romania
Soviet Union
4 or more Vehicles in Household
4 or more Vehicles in Household Comparison
Immigrants from Romania
Soviet Union
6.0%
4 OR MORE VEHICLES IN HOUSEHOLD
13.8/ 100
METRIC RATING
216th/ 347
METRIC RANK
4.4%
4 OR MORE VEHICLES IN HOUSEHOLD
0.0/ 100
METRIC RATING
324th/ 347
METRIC RANK
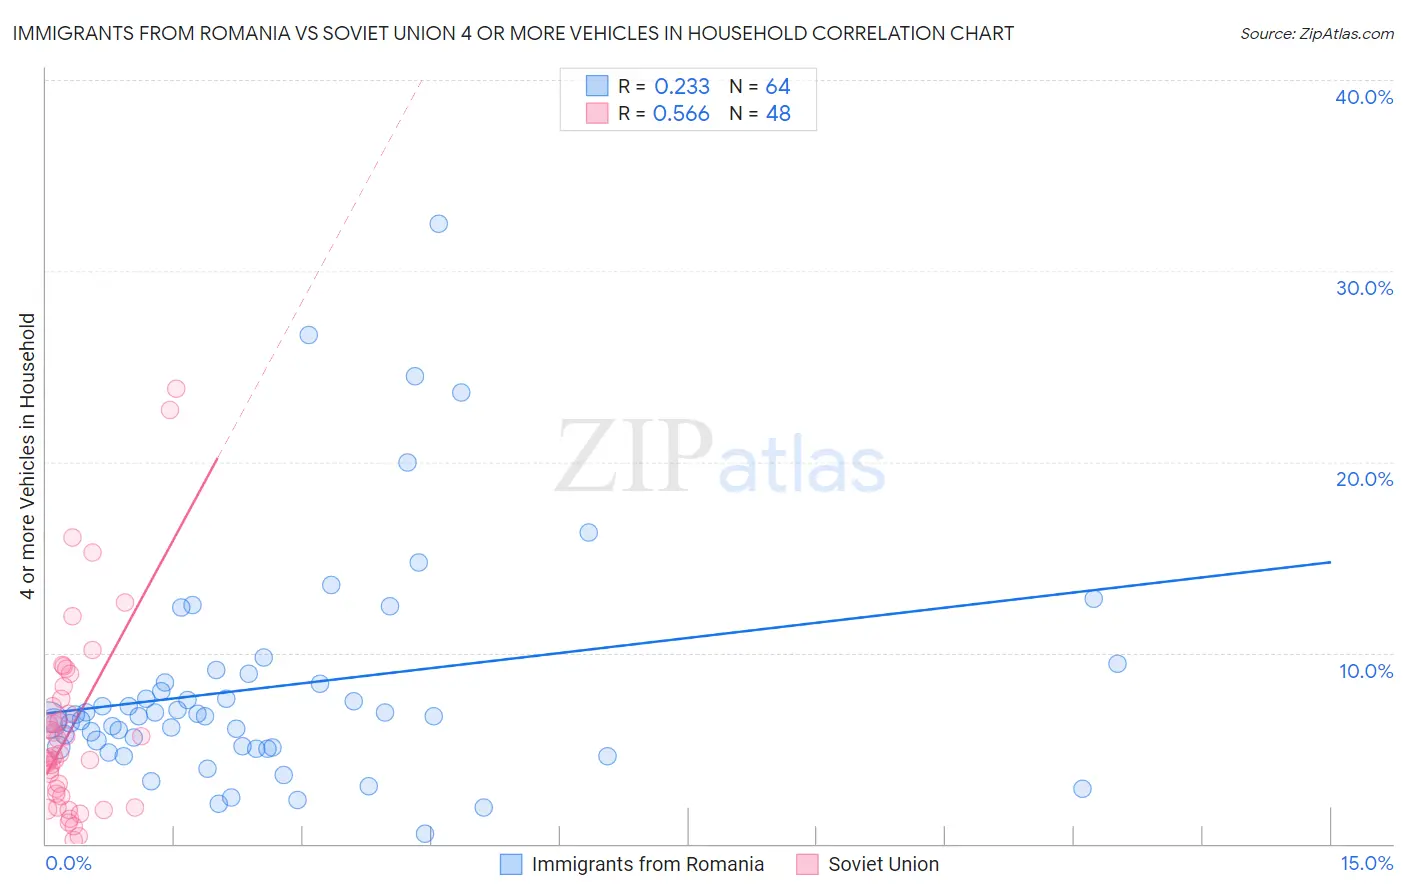
Immigrants from Romania vs Soviet Union 4 or more Vehicles in Household Correlation Chart
The statistical analysis conducted on geographies consisting of 256,113,445 people shows a weak positive correlation between the proportion of Immigrants from Romania and percentage of households with 4 or more vehicles available in the United States with a correlation coefficient (R) of 0.233 and weighted average of 6.0%. Similarly, the statistical analysis conducted on geographies consisting of 43,372,100 people shows a substantial positive correlation between the proportion of Soviet Union and percentage of households with 4 or more vehicles available in the United States with a correlation coefficient (R) of 0.566 and weighted average of 4.4%, a difference of 36.3%.
4 or more Vehicles in Household Correlation Summary
| Measurement | Immigrants from Romania | Soviet Union |
| Minimum | 0.55% | 0.22% |
| Maximum | 32.5% | 23.8% |
| Range | 31.9% | 23.6% |
| Mean | 8.2% | 6.2% |
| Median | 6.7% | 4.7% |
| Interquartile 25% (IQ1) | 5.0% | 2.6% |
| Interquartile 75% (IQ3) | 8.7% | 7.9% |
| Interquartile Range (IQR) | 3.6% | 5.4% |
| Standard Deviation (Sample) | 6.0% | 5.1% |
| Standard Deviation (Population) | 6.0% | 5.1% |
Similar Demographics by 4 or more Vehicles in Household
Demographics Similar to Immigrants from Romania by 4 or more Vehicles in Household
In terms of 4 or more vehicles in household, the demographic groups most similar to Immigrants from Romania are Immigrants from China (6.0%, a difference of 0.0%), Immigrants from Austria (6.0%, a difference of 0.11%), Arab (6.0%, a difference of 0.13%), Immigrants from Egypt (6.0%, a difference of 0.19%), and Panamanian (6.0%, a difference of 0.20%).
| Demographics | Rating | Rank | 4 or more Vehicles in Household |
| Immigrants | Honduras | 15.4 /100 | #209 | Poor 6.1% |
| Immigrants | Zimbabwe | 15.1 /100 | #210 | Poor 6.0% |
| Panamanians | 14.8 /100 | #211 | Poor 6.0% |
| Immigrants | Egypt | 14.7 /100 | #212 | Poor 6.0% |
| Arabs | 14.4 /100 | #213 | Poor 6.0% |
| Immigrants | Austria | 14.3 /100 | #214 | Poor 6.0% |
| Immigrants | China | 13.8 /100 | #215 | Poor 6.0% |
| Immigrants | Romania | 13.8 /100 | #216 | Poor 6.0% |
| Nigerians | 12.2 /100 | #217 | Poor 6.0% |
| Immigrants | Italy | 11.0 /100 | #218 | Poor 6.0% |
| Serbians | 11.0 /100 | #219 | Poor 6.0% |
| Russians | 10.3 /100 | #220 | Poor 6.0% |
| Immigrants | Moldova | 9.3 /100 | #221 | Tragic 6.0% |
| Cajuns | 9.2 /100 | #222 | Tragic 6.0% |
| Immigrants | Kenya | 9.2 /100 | #223 | Tragic 6.0% |
Demographics Similar to Soviet Union by 4 or more Vehicles in Household
In terms of 4 or more vehicles in household, the demographic groups most similar to Soviet Union are Immigrants from Caribbean (4.4%, a difference of 0.28%), Immigrants from Jamaica (4.4%, a difference of 0.32%), Cape Verdean (4.4%, a difference of 0.64%), Immigrants from Yemen (4.5%, a difference of 0.69%), and Ecuadorian (4.5%, a difference of 0.86%).
| Demographics | Rating | Rank | 4 or more Vehicles in Household |
| U.S. Virgin Islanders | 0.0 /100 | #317 | Tragic 4.6% |
| Jamaicans | 0.0 /100 | #318 | Tragic 4.6% |
| Haitians | 0.0 /100 | #319 | Tragic 4.6% |
| Immigrants | Haiti | 0.0 /100 | #320 | Tragic 4.5% |
| Ecuadorians | 0.0 /100 | #321 | Tragic 4.5% |
| Immigrants | Yemen | 0.0 /100 | #322 | Tragic 4.5% |
| Immigrants | Caribbean | 0.0 /100 | #323 | Tragic 4.4% |
| Soviet Union | 0.0 /100 | #324 | Tragic 4.4% |
| Immigrants | Jamaica | 0.0 /100 | #325 | Tragic 4.4% |
| Cape Verdeans | 0.0 /100 | #326 | Tragic 4.4% |
| Senegalese | 0.0 /100 | #327 | Tragic 4.3% |
| Trinidadians and Tobagonians | 0.0 /100 | #328 | Tragic 4.3% |
| Immigrants | Senegal | 0.0 /100 | #329 | Tragic 4.2% |
| Immigrants | Ecuador | 0.0 /100 | #330 | Tragic 4.2% |
| West Indians | 0.0 /100 | #331 | Tragic 4.2% |