Immigrants from Korea vs Immigrants from Canada 4 or more Vehicles in Household
COMPARE
Immigrants from Korea
Immigrants from Canada
4 or more Vehicles in Household
4 or more Vehicles in Household Comparison
Immigrants from Korea
Immigrants from Canada
6.8%
4 OR MORE VEHICLES IN HOUSEHOLD
93.8/ 100
METRIC RATING
127th/ 347
METRIC RANK
6.5%
4 OR MORE VEHICLES IN HOUSEHOLD
78.6/ 100
METRIC RATING
143rd/ 347
METRIC RANK
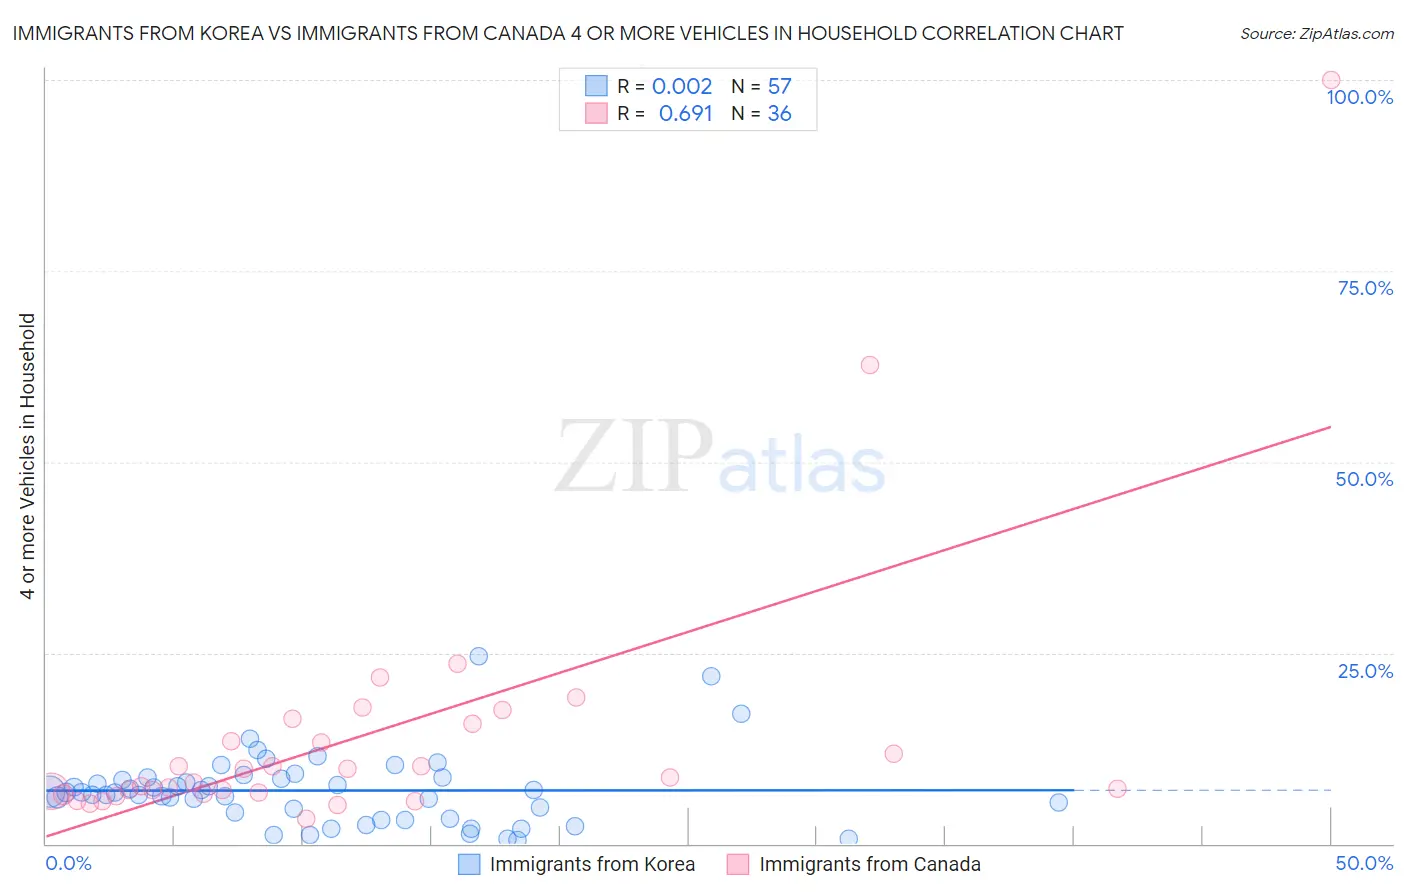
Immigrants from Korea vs Immigrants from Canada 4 or more Vehicles in Household Correlation Chart
The statistical analysis conducted on geographies consisting of 414,077,591 people shows no correlation between the proportion of Immigrants from Korea and percentage of households with 4 or more vehicles available in the United States with a correlation coefficient (R) of 0.002 and weighted average of 6.8%. Similarly, the statistical analysis conducted on geographies consisting of 457,196,725 people shows a significant positive correlation between the proportion of Immigrants from Canada and percentage of households with 4 or more vehicles available in the United States with a correlation coefficient (R) of 0.691 and weighted average of 6.5%, a difference of 3.5%.
4 or more Vehicles in Household Correlation Summary
| Measurement | Immigrants from Korea | Immigrants from Canada |
| Minimum | 0.44% | 3.3% |
| Maximum | 24.6% | 100.0% |
| Range | 24.1% | 96.7% |
| Mean | 7.0% | 14.1% |
| Median | 6.7% | 8.4% |
| Interquartile 25% (IQ1) | 3.7% | 6.7% |
| Interquartile 75% (IQ3) | 8.6% | 14.6% |
| Interquartile Range (IQR) | 5.0% | 7.9% |
| Standard Deviation (Sample) | 4.7% | 17.9% |
| Standard Deviation (Population) | 4.6% | 17.6% |
Demographics Similar to Immigrants from Korea and Immigrants from Canada by 4 or more Vehicles in Household
In terms of 4 or more vehicles in household, the demographic groups most similar to Immigrants from Korea are Belgian (6.8%, a difference of 0.12%), Austrian (6.8%, a difference of 0.13%), Immigrants from Bolivia (6.7%, a difference of 0.50%), Immigrants from England (6.7%, a difference of 0.66%), and Immigrants from Scotland (6.7%, a difference of 1.5%). Similarly, the demographic groups most similar to Immigrants from Canada are Immigrants from North America (6.5%, a difference of 0.020%), Croatian (6.5%, a difference of 0.11%), Immigrants from Iraq (6.5%, a difference of 0.13%), Australian (6.6%, a difference of 0.33%), and Slavic (6.6%, a difference of 0.46%).
| Demographics | Rating | Rank | 4 or more Vehicles in Household |
| Austrians | 94.1 /100 | #125 | Exceptional 6.8% |
| Belgians | 94.1 /100 | #126 | Exceptional 6.8% |
| Immigrants | Korea | 93.8 /100 | #127 | Exceptional 6.8% |
| Immigrants | Bolivia | 92.5 /100 | #128 | Exceptional 6.7% |
| Immigrants | England | 92.0 /100 | #129 | Exceptional 6.7% |
| Immigrants | Scotland | 89.0 /100 | #130 | Excellent 6.7% |
| Maltese | 88.4 /100 | #131 | Excellent 6.7% |
| Immigrants | Netherlands | 87.8 /100 | #132 | Excellent 6.6% |
| Armenians | 86.9 /100 | #133 | Excellent 6.6% |
| Ottawa | 86.9 /100 | #134 | Excellent 6.6% |
| Tohono O'odham | 86.7 /100 | #135 | Excellent 6.6% |
| Luxembourgers | 86.4 /100 | #136 | Excellent 6.6% |
| French Canadians | 85.4 /100 | #137 | Excellent 6.6% |
| Italians | 84.5 /100 | #138 | Excellent 6.6% |
| Jordanians | 82.1 /100 | #139 | Excellent 6.6% |
| Slavs | 81.6 /100 | #140 | Excellent 6.6% |
| Australians | 80.8 /100 | #141 | Excellent 6.6% |
| Immigrants | Iraq | 79.4 /100 | #142 | Good 6.5% |
| Immigrants | Canada | 78.6 /100 | #143 | Good 6.5% |
| Immigrants | North America | 78.5 /100 | #144 | Good 6.5% |
| Croatians | 77.8 /100 | #145 | Good 6.5% |