Immigrants from Korea vs Zimbabwean 4 or more Vehicles in Household
COMPARE
Immigrants from Korea
Zimbabwean
4 or more Vehicles in Household
4 or more Vehicles in Household Comparison
Immigrants from Korea
Zimbabweans
6.8%
4 OR MORE VEHICLES IN HOUSEHOLD
93.8/ 100
METRIC RATING
127th/ 347
METRIC RANK
6.4%
4 OR MORE VEHICLES IN HOUSEHOLD
67.1/ 100
METRIC RATING
158th/ 347
METRIC RANK
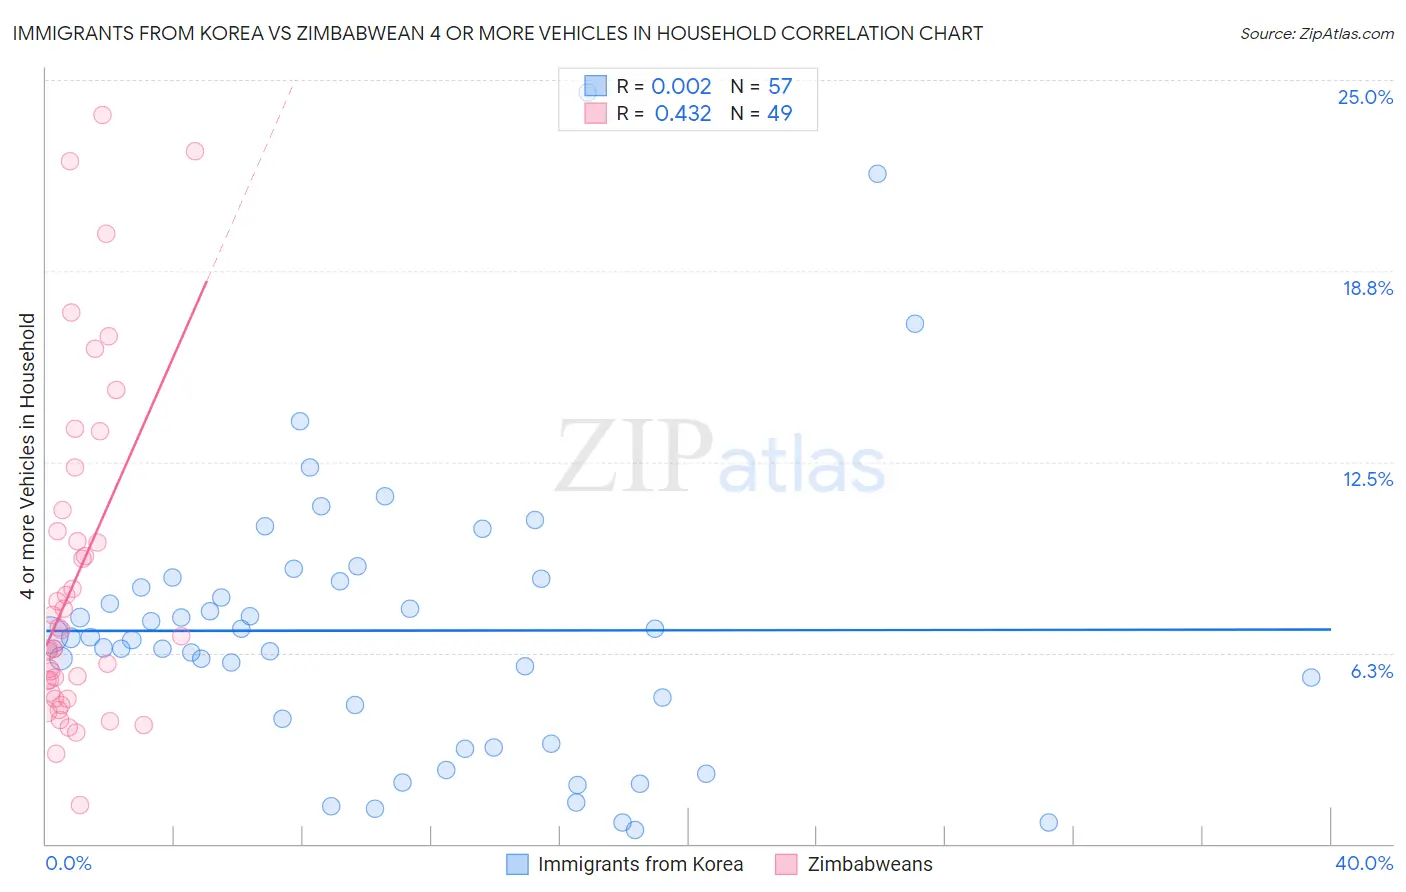
Immigrants from Korea vs Zimbabwean 4 or more Vehicles in Household Correlation Chart
The statistical analysis conducted on geographies consisting of 414,077,591 people shows no correlation between the proportion of Immigrants from Korea and percentage of households with 4 or more vehicles available in the United States with a correlation coefficient (R) of 0.002 and weighted average of 6.8%. Similarly, the statistical analysis conducted on geographies consisting of 69,013,822 people shows a moderate positive correlation between the proportion of Zimbabweans and percentage of households with 4 or more vehicles available in the United States with a correlation coefficient (R) of 0.432 and weighted average of 6.4%, a difference of 5.0%.
4 or more Vehicles in Household Correlation Summary
| Measurement | Immigrants from Korea | Zimbabwean |
| Minimum | 0.44% | 1.3% |
| Maximum | 24.6% | 23.8% |
| Range | 24.1% | 22.6% |
| Mean | 7.0% | 8.8% |
| Median | 6.7% | 6.8% |
| Interquartile 25% (IQ1) | 3.7% | 4.9% |
| Interquartile 75% (IQ3) | 8.6% | 10.6% |
| Interquartile Range (IQR) | 5.0% | 5.7% |
| Standard Deviation (Sample) | 4.7% | 5.5% |
| Standard Deviation (Population) | 4.6% | 5.4% |
Similar Demographics by 4 or more Vehicles in Household
Demographics Similar to Immigrants from Korea by 4 or more Vehicles in Household
In terms of 4 or more vehicles in household, the demographic groups most similar to Immigrants from Korea are Belgian (6.8%, a difference of 0.12%), Austrian (6.8%, a difference of 0.13%), Immigrants from Asia (6.8%, a difference of 0.23%), Immigrants (6.8%, a difference of 0.33%), and Immigrants from Germany (6.8%, a difference of 0.39%).
| Demographics | Rating | Rank | 4 or more Vehicles in Household |
| Comanche | 94.8 /100 | #120 | Exceptional 6.8% |
| Immigrants | Germany | 94.7 /100 | #121 | Exceptional 6.8% |
| Immigrants | Nicaragua | 94.7 /100 | #122 | Exceptional 6.8% |
| Immigrants | Immigrants | 94.6 /100 | #123 | Exceptional 6.8% |
| Immigrants | Asia | 94.4 /100 | #124 | Exceptional 6.8% |
| Austrians | 94.1 /100 | #125 | Exceptional 6.8% |
| Belgians | 94.1 /100 | #126 | Exceptional 6.8% |
| Immigrants | Korea | 93.8 /100 | #127 | Exceptional 6.8% |
| Immigrants | Bolivia | 92.5 /100 | #128 | Exceptional 6.7% |
| Immigrants | England | 92.0 /100 | #129 | Exceptional 6.7% |
| Immigrants | Scotland | 89.0 /100 | #130 | Excellent 6.7% |
| Maltese | 88.4 /100 | #131 | Excellent 6.7% |
| Immigrants | Netherlands | 87.8 /100 | #132 | Excellent 6.6% |
| Armenians | 86.9 /100 | #133 | Excellent 6.6% |
| Ottawa | 86.9 /100 | #134 | Excellent 6.6% |
Demographics Similar to Zimbabweans by 4 or more Vehicles in Household
In terms of 4 or more vehicles in household, the demographic groups most similar to Zimbabweans are Indian (Asian) (6.4%, a difference of 0.090%), Palestinian (6.4%, a difference of 0.15%), Peruvian (6.5%, a difference of 0.27%), Immigrants from Cameroon (6.4%, a difference of 0.30%), and Iranian (6.5%, a difference of 0.32%).
| Demographics | Rating | Rank | 4 or more Vehicles in Household |
| Immigrants | Hong Kong | 72.2 /100 | #151 | Good 6.5% |
| Yuman | 72.1 /100 | #152 | Good 6.5% |
| Immigrants | Armenia | 71.2 /100 | #153 | Good 6.5% |
| Central American Indians | 71.1 /100 | #154 | Good 6.5% |
| Iroquois | 70.4 /100 | #155 | Good 6.5% |
| Iranians | 69.9 /100 | #156 | Good 6.5% |
| Peruvians | 69.4 /100 | #157 | Good 6.5% |
| Zimbabweans | 67.1 /100 | #158 | Good 6.4% |
| Indians (Asian) | 66.3 /100 | #159 | Good 6.4% |
| Palestinians | 65.8 /100 | #160 | Good 6.4% |
| Immigrants | Cameroon | 64.4 /100 | #161 | Good 6.4% |
| Immigrants | Pakistan | 63.2 /100 | #162 | Good 6.4% |
| Chileans | 61.2 /100 | #163 | Good 6.4% |
| Hungarians | 61.1 /100 | #164 | Good 6.4% |
| Immigrants | Peru | 59.8 /100 | #165 | Average 6.4% |