Immigrants from Europe vs Soviet Union 4 or more Vehicles in Household
COMPARE
Immigrants from Europe
Soviet Union
4 or more Vehicles in Household
4 or more Vehicles in Household Comparison
Immigrants from Europe
Soviet Union
5.7%
4 OR MORE VEHICLES IN HOUSEHOLD
2.3/ 100
METRIC RATING
250th/ 347
METRIC RANK
4.4%
4 OR MORE VEHICLES IN HOUSEHOLD
0.0/ 100
METRIC RATING
324th/ 347
METRIC RANK
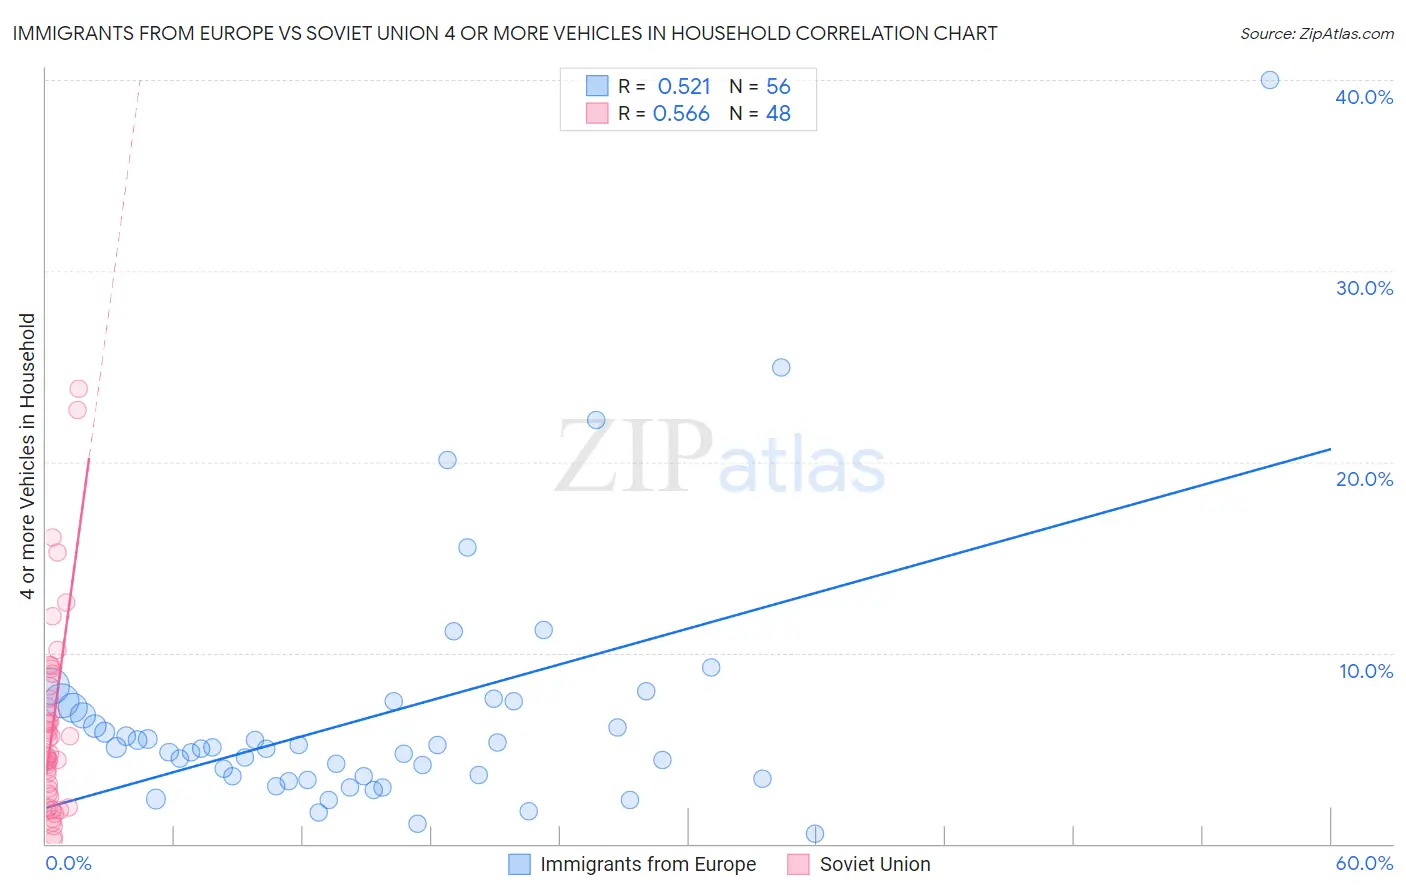
Immigrants from Europe vs Soviet Union 4 or more Vehicles in Household Correlation Chart
The statistical analysis conducted on geographies consisting of 544,257,144 people shows a substantial positive correlation between the proportion of Immigrants from Europe and percentage of households with 4 or more vehicles available in the United States with a correlation coefficient (R) of 0.521 and weighted average of 5.7%. Similarly, the statistical analysis conducted on geographies consisting of 43,372,100 people shows a substantial positive correlation between the proportion of Soviet Union and percentage of households with 4 or more vehicles available in the United States with a correlation coefficient (R) of 0.566 and weighted average of 4.4%, a difference of 29.3%.
4 or more Vehicles in Household Correlation Summary
| Measurement | Immigrants from Europe | Soviet Union |
| Minimum | 0.50% | 0.22% |
| Maximum | 40.0% | 23.8% |
| Range | 39.5% | 23.6% |
| Mean | 6.7% | 6.2% |
| Median | 5.0% | 4.7% |
| Interquartile 25% (IQ1) | 3.5% | 2.6% |
| Interquartile 75% (IQ3) | 7.3% | 7.9% |
| Interquartile Range (IQR) | 3.8% | 5.4% |
| Standard Deviation (Sample) | 6.6% | 5.1% |
| Standard Deviation (Population) | 6.5% | 5.1% |
Similar Demographics by 4 or more Vehicles in Household
Demographics Similar to Immigrants from Europe by 4 or more Vehicles in Household
In terms of 4 or more vehicles in household, the demographic groups most similar to Immigrants from Europe are Ugandan (5.7%, a difference of 0.020%), Immigrants from Southern Europe (5.7%, a difference of 0.10%), Immigrants from Eastern Africa (5.7%, a difference of 0.12%), Immigrants from Ethiopia (5.7%, a difference of 0.23%), and Subsaharan African (5.7%, a difference of 0.25%).
| Demographics | Rating | Rank | 4 or more Vehicles in Household |
| Immigrants | Czechoslovakia | 3.2 /100 | #243 | Tragic 5.8% |
| Ethiopians | 3.2 /100 | #244 | Tragic 5.8% |
| Bulgarians | 3.1 /100 | #245 | Tragic 5.8% |
| Immigrants | North Macedonia | 2.5 /100 | #246 | Tragic 5.7% |
| Immigrants | Ethiopia | 2.4 /100 | #247 | Tragic 5.7% |
| Immigrants | Eastern Africa | 2.4 /100 | #248 | Tragic 5.7% |
| Immigrants | Southern Europe | 2.3 /100 | #249 | Tragic 5.7% |
| Immigrants | Europe | 2.3 /100 | #250 | Tragic 5.7% |
| Ugandans | 2.2 /100 | #251 | Tragic 5.7% |
| Sub-Saharan Africans | 2.1 /100 | #252 | Tragic 5.7% |
| Immigrants | Cuba | 1.6 /100 | #253 | Tragic 5.7% |
| Immigrants | Panama | 1.5 /100 | #254 | Tragic 5.7% |
| Yup'ik | 1.5 /100 | #255 | Tragic 5.7% |
| Immigrants | Turkey | 1.5 /100 | #256 | Tragic 5.7% |
| Immigrants | Northern Africa | 1.4 /100 | #257 | Tragic 5.6% |
Demographics Similar to Soviet Union by 4 or more Vehicles in Household
In terms of 4 or more vehicles in household, the demographic groups most similar to Soviet Union are Immigrants from Caribbean (4.4%, a difference of 0.28%), Immigrants from Jamaica (4.4%, a difference of 0.32%), Cape Verdean (4.4%, a difference of 0.64%), Immigrants from Yemen (4.5%, a difference of 0.69%), and Ecuadorian (4.5%, a difference of 0.86%).
| Demographics | Rating | Rank | 4 or more Vehicles in Household |
| U.S. Virgin Islanders | 0.0 /100 | #317 | Tragic 4.6% |
| Jamaicans | 0.0 /100 | #318 | Tragic 4.6% |
| Haitians | 0.0 /100 | #319 | Tragic 4.6% |
| Immigrants | Haiti | 0.0 /100 | #320 | Tragic 4.5% |
| Ecuadorians | 0.0 /100 | #321 | Tragic 4.5% |
| Immigrants | Yemen | 0.0 /100 | #322 | Tragic 4.5% |
| Immigrants | Caribbean | 0.0 /100 | #323 | Tragic 4.4% |
| Soviet Union | 0.0 /100 | #324 | Tragic 4.4% |
| Immigrants | Jamaica | 0.0 /100 | #325 | Tragic 4.4% |
| Cape Verdeans | 0.0 /100 | #326 | Tragic 4.4% |
| Senegalese | 0.0 /100 | #327 | Tragic 4.3% |
| Trinidadians and Tobagonians | 0.0 /100 | #328 | Tragic 4.3% |
| Immigrants | Senegal | 0.0 /100 | #329 | Tragic 4.2% |
| Immigrants | Ecuador | 0.0 /100 | #330 | Tragic 4.2% |
| West Indians | 0.0 /100 | #331 | Tragic 4.2% |