Immigrants from Korea vs Albanian 2 or more Vehicles in Household
COMPARE
Immigrants from Korea
Albanian
2 or more Vehicles in Household
2 or more Vehicles in Household Comparison
Immigrants from Korea
Albanians
57.6%
2 OR MORE VEHICLES IN HOUSEHOLD
98.2/ 100
METRIC RATING
105th/ 347
METRIC RANK
49.0%
2 OR MORE VEHICLES IN HOUSEHOLD
0.0/ 100
METRIC RATING
308th/ 347
METRIC RANK
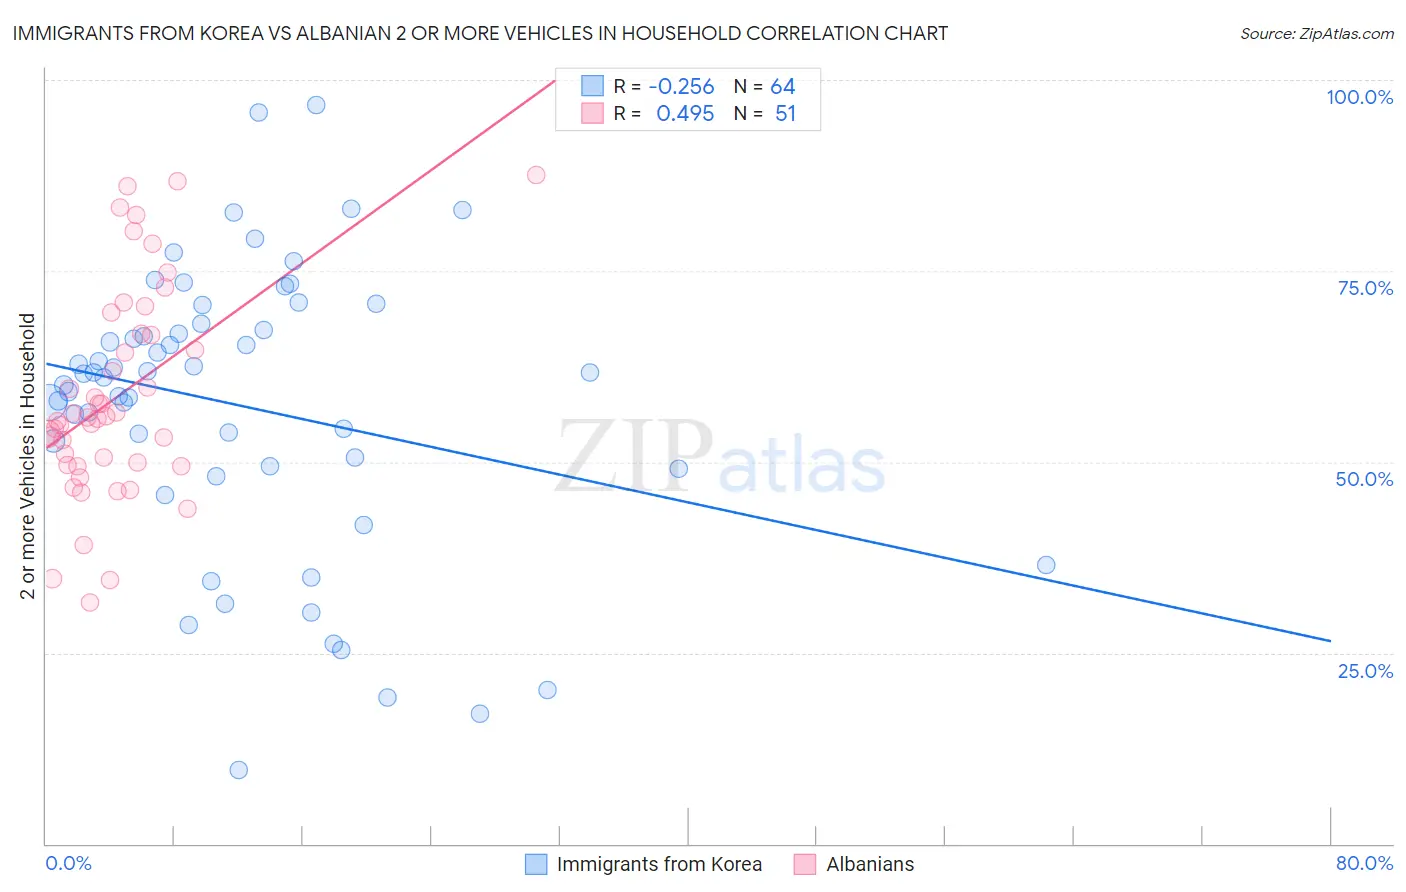
Immigrants from Korea vs Albanian 2 or more Vehicles in Household Correlation Chart
The statistical analysis conducted on geographies consisting of 416,005,379 people shows a weak negative correlation between the proportion of Immigrants from Korea and percentage of households with 2 or more vehicles available in the United States with a correlation coefficient (R) of -0.256 and weighted average of 57.6%. Similarly, the statistical analysis conducted on geographies consisting of 193,189,951 people shows a moderate positive correlation between the proportion of Albanians and percentage of households with 2 or more vehicles available in the United States with a correlation coefficient (R) of 0.495 and weighted average of 49.0%, a difference of 17.5%.
2 or more Vehicles in Household Correlation Summary
| Measurement | Immigrants from Korea | Albanian |
| Minimum | 9.7% | 31.6% |
| Maximum | 96.7% | 87.5% |
| Range | 86.9% | 55.9% |
| Mean | 57.3% | 58.6% |
| Median | 61.3% | 55.7% |
| Interquartile 25% (IQ1) | 49.3% | 49.6% |
| Interquartile 75% (IQ3) | 67.7% | 66.8% |
| Interquartile Range (IQR) | 18.4% | 17.2% |
| Standard Deviation (Sample) | 18.6% | 13.7% |
| Standard Deviation (Population) | 18.5% | 13.5% |
Similar Demographics by 2 or more Vehicles in Household
Demographics Similar to Immigrants from Korea by 2 or more Vehicles in Household
In terms of 2 or more vehicles in household, the demographic groups most similar to Immigrants from Korea are Immigrants from Indonesia (57.6%, a difference of 0.0%), Immigrants from Bolivia (57.6%, a difference of 0.010%), Jordanian (57.6%, a difference of 0.010%), Immigrants from Oceania (57.5%, a difference of 0.020%), and Immigrants from Netherlands (57.5%, a difference of 0.030%).
| Demographics | Rating | Rank | 2 or more Vehicles in Household |
| Palestinians | 98.6 /100 | #98 | Exceptional 57.7% |
| Cajuns | 98.5 /100 | #99 | Exceptional 57.7% |
| Fijians | 98.4 /100 | #100 | Exceptional 57.6% |
| Lebanese | 98.3 /100 | #101 | Exceptional 57.6% |
| Immigrants | Bolivia | 98.2 /100 | #102 | Exceptional 57.6% |
| Jordanians | 98.2 /100 | #103 | Exceptional 57.6% |
| Immigrants | Indonesia | 98.2 /100 | #104 | Exceptional 57.6% |
| Immigrants | Korea | 98.2 /100 | #105 | Exceptional 57.6% |
| Immigrants | Oceania | 98.2 /100 | #106 | Exceptional 57.5% |
| Immigrants | Netherlands | 98.2 /100 | #107 | Exceptional 57.5% |
| Immigrants | Canada | 98.1 /100 | #108 | Exceptional 57.5% |
| Immigrants | North America | 98.1 /100 | #109 | Exceptional 57.5% |
| Japanese | 98.0 /100 | #110 | Exceptional 57.5% |
| Greeks | 98.0 /100 | #111 | Exceptional 57.5% |
| Pueblo | 98.0 /100 | #112 | Exceptional 57.5% |
Demographics Similar to Albanians by 2 or more Vehicles in Household
In terms of 2 or more vehicles in household, the demographic groups most similar to Albanians are Hopi (49.0%, a difference of 0.070%), Moroccan (48.8%, a difference of 0.35%), Immigrants from Israel (49.2%, a difference of 0.50%), Immigrants from Western Africa (49.4%, a difference of 0.76%), and Immigrants from Belize (49.9%, a difference of 1.8%).
| Demographics | Rating | Rank | 2 or more Vehicles in Household |
| Immigrants | Greece | 0.0 /100 | #301 | Tragic 50.2% |
| Immigrants | South America | 0.0 /100 | #302 | Tragic 50.2% |
| Tohono O'odham | 0.0 /100 | #303 | Tragic 50.0% |
| Immigrants | Belize | 0.0 /100 | #304 | Tragic 49.9% |
| Immigrants | Western Africa | 0.0 /100 | #305 | Tragic 49.4% |
| Immigrants | Israel | 0.0 /100 | #306 | Tragic 49.2% |
| Hopi | 0.0 /100 | #307 | Tragic 49.0% |
| Albanians | 0.0 /100 | #308 | Tragic 49.0% |
| Moroccans | 0.0 /100 | #309 | Tragic 48.8% |
| Ghanaians | 0.0 /100 | #310 | Tragic 48.0% |
| Immigrants | Belarus | 0.0 /100 | #311 | Tragic 47.9% |
| Haitians | 0.0 /100 | #312 | Tragic 47.6% |
| U.S. Virgin Islanders | 0.0 /100 | #313 | Tragic 47.5% |
| Immigrants | Ghana | 0.0 /100 | #314 | Tragic 47.4% |
| Puerto Ricans | 0.0 /100 | #315 | Tragic 47.1% |