Immigrants from Korea vs Potawatomi 2 or more Vehicles in Household
COMPARE
Immigrants from Korea
Potawatomi
2 or more Vehicles in Household
2 or more Vehicles in Household Comparison
Immigrants from Korea
Potawatomi
57.6%
2 OR MORE VEHICLES IN HOUSEHOLD
98.2/ 100
METRIC RATING
105th/ 347
METRIC RANK
58.0%
2 OR MORE VEHICLES IN HOUSEHOLD
99.1/ 100
METRIC RATING
86th/ 347
METRIC RANK
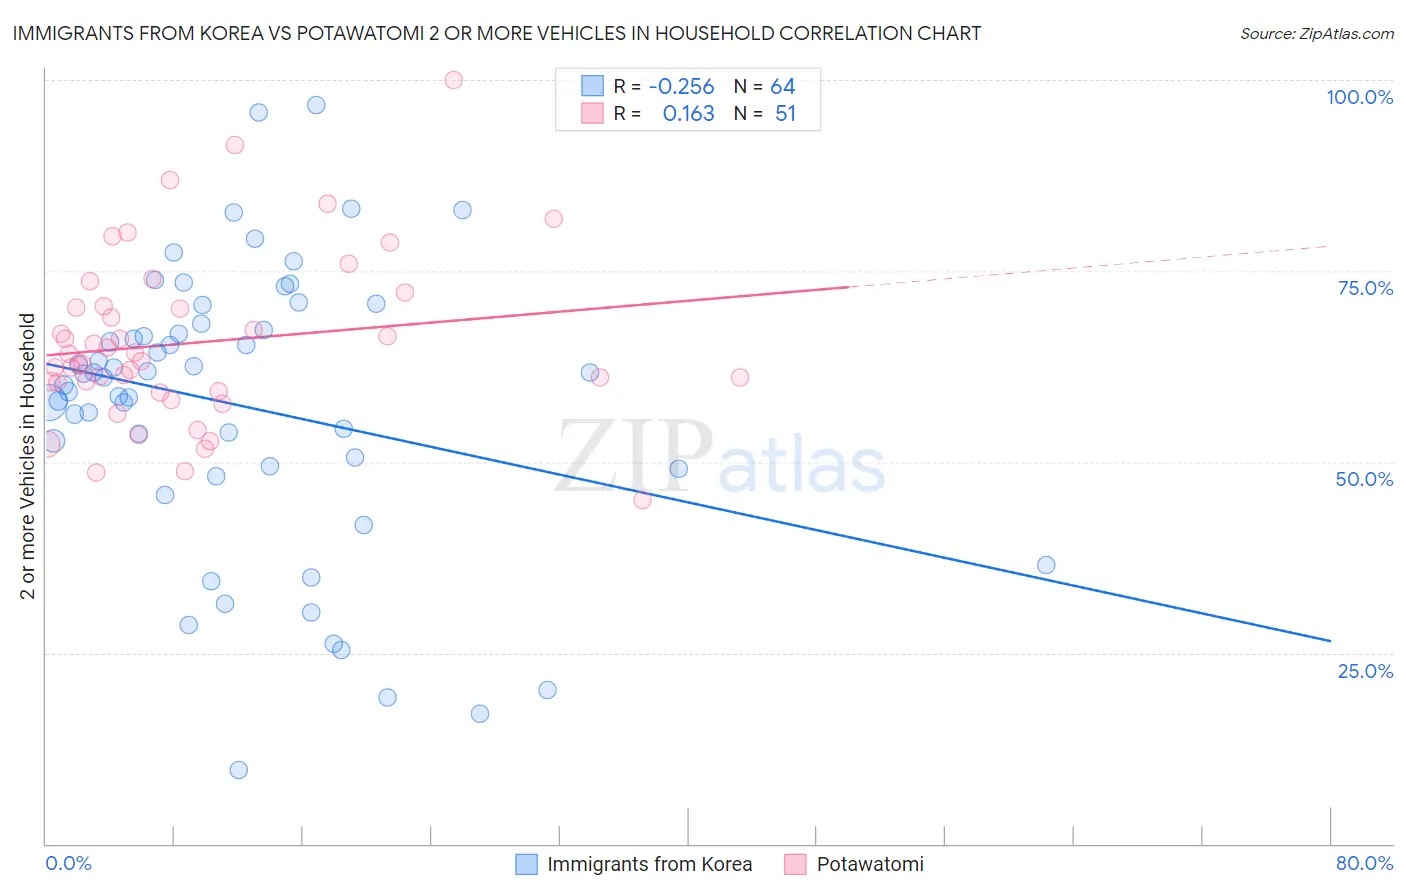
Immigrants from Korea vs Potawatomi 2 or more Vehicles in Household Correlation Chart
The statistical analysis conducted on geographies consisting of 416,005,379 people shows a weak negative correlation between the proportion of Immigrants from Korea and percentage of households with 2 or more vehicles available in the United States with a correlation coefficient (R) of -0.256 and weighted average of 57.6%. Similarly, the statistical analysis conducted on geographies consisting of 117,759,902 people shows a poor positive correlation between the proportion of Potawatomi and percentage of households with 2 or more vehicles available in the United States with a correlation coefficient (R) of 0.163 and weighted average of 58.0%, a difference of 0.71%.
2 or more Vehicles in Household Correlation Summary
| Measurement | Immigrants from Korea | Potawatomi |
| Minimum | 9.7% | 45.0% |
| Maximum | 96.7% | 100.0% |
| Range | 86.9% | 55.0% |
| Mean | 57.3% | 65.6% |
| Median | 61.3% | 63.1% |
| Interquartile 25% (IQ1) | 49.3% | 59.2% |
| Interquartile 75% (IQ3) | 67.7% | 70.3% |
| Interquartile Range (IQR) | 18.4% | 11.1% |
| Standard Deviation (Sample) | 18.6% | 11.1% |
| Standard Deviation (Population) | 18.5% | 11.0% |
Demographics Similar to Immigrants from Korea and Potawatomi by 2 or more Vehicles in Household
In terms of 2 or more vehicles in household, the demographic groups most similar to Immigrants from Korea are Immigrants from Indonesia (57.6%, a difference of 0.0%), Immigrants from Bolivia (57.6%, a difference of 0.010%), Jordanian (57.6%, a difference of 0.010%), Lebanese (57.6%, a difference of 0.050%), and Fijian (57.6%, a difference of 0.10%). Similarly, the demographic groups most similar to Potawatomi are Slovak (58.0%, a difference of 0.030%), Thai (57.9%, a difference of 0.040%), Immigrants from Iran (57.9%, a difference of 0.050%), Immigrants from Germany (57.9%, a difference of 0.11%), and Hispanic or Latino (57.9%, a difference of 0.11%).
| Demographics | Rating | Rank | 2 or more Vehicles in Household |
| Slovaks | 99.2 /100 | #85 | Exceptional 58.0% |
| Potawatomi | 99.1 /100 | #86 | Exceptional 58.0% |
| Thais | 99.1 /100 | #87 | Exceptional 57.9% |
| Immigrants | Iran | 99.1 /100 | #88 | Exceptional 57.9% |
| Immigrants | Germany | 99.0 /100 | #89 | Exceptional 57.9% |
| Hispanics or Latinos | 99.0 /100 | #90 | Exceptional 57.9% |
| Pakistanis | 99.0 /100 | #91 | Exceptional 57.9% |
| Shoshone | 99.0 /100 | #92 | Exceptional 57.9% |
| Ottawa | 99.0 /100 | #93 | Exceptional 57.9% |
| Filipinos | 98.9 /100 | #94 | Exceptional 57.8% |
| Hmong | 98.9 /100 | #95 | Exceptional 57.8% |
| Burmese | 98.8 /100 | #96 | Exceptional 57.8% |
| Slavs | 98.8 /100 | #97 | Exceptional 57.8% |
| Palestinians | 98.6 /100 | #98 | Exceptional 57.7% |
| Cajuns | 98.5 /100 | #99 | Exceptional 57.7% |
| Fijians | 98.4 /100 | #100 | Exceptional 57.6% |
| Lebanese | 98.3 /100 | #101 | Exceptional 57.6% |
| Immigrants | Bolivia | 98.2 /100 | #102 | Exceptional 57.6% |
| Jordanians | 98.2 /100 | #103 | Exceptional 57.6% |
| Immigrants | Indonesia | 98.2 /100 | #104 | Exceptional 57.6% |
| Immigrants | Korea | 98.2 /100 | #105 | Exceptional 57.6% |