Cajun vs Albanian 1 or more Vehicles in Household
COMPARE
Cajun
Albanian
1 or more Vehicles in Household
1 or more Vehicles in Household Comparison
Cajuns
Albanians
91.7%
1 OR MORE VEHICLES IN HOUSEHOLD
99.7/ 100
METRIC RATING
72nd/ 347
METRIC RANK
84.4%
1 OR MORE VEHICLES IN HOUSEHOLD
0.0/ 100
METRIC RATING
314th/ 347
METRIC RANK
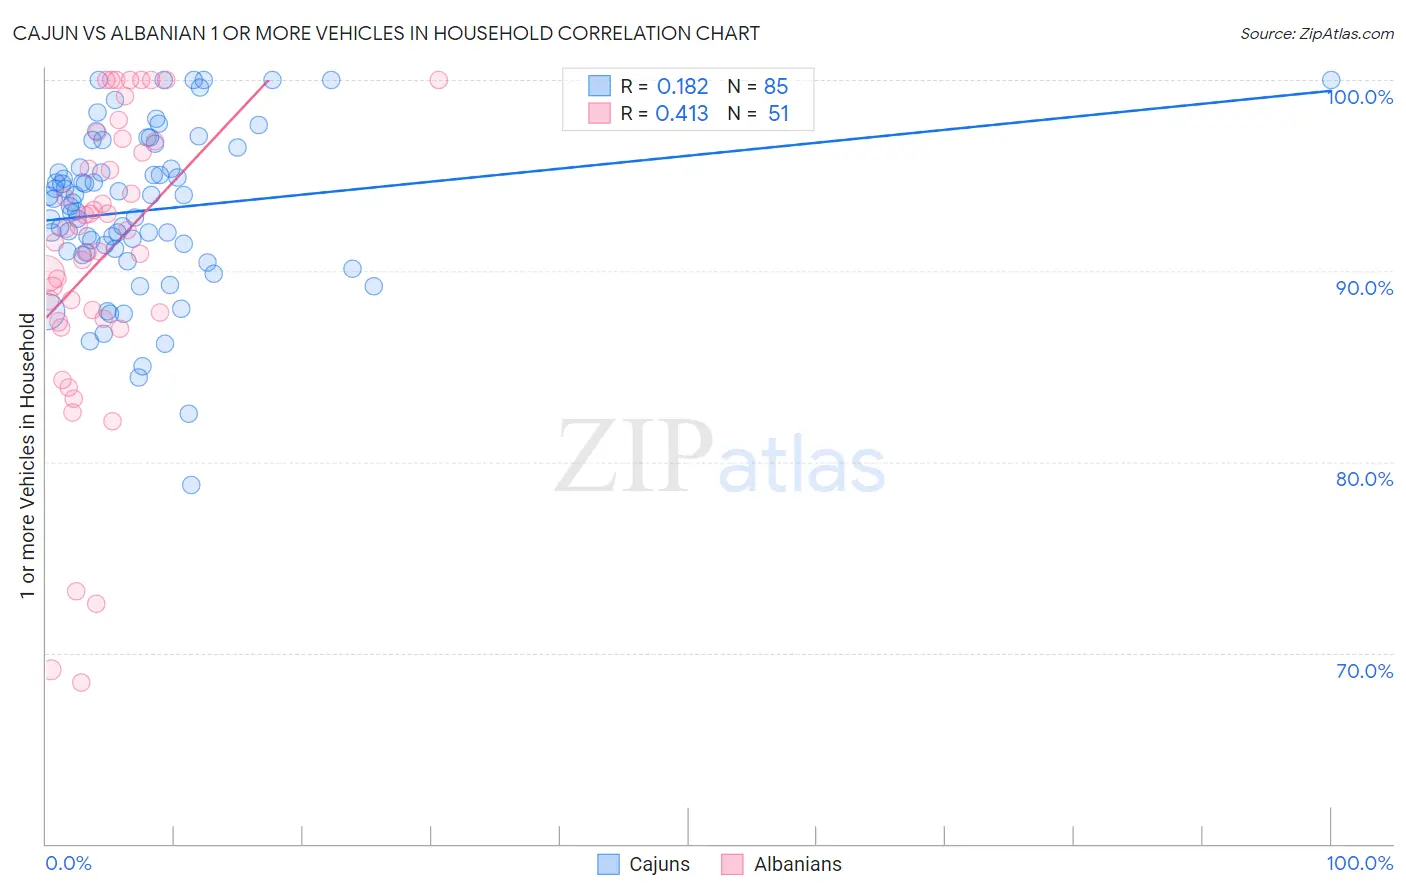
Cajun vs Albanian 1 or more Vehicles in Household Correlation Chart
The statistical analysis conducted on geographies consisting of 149,696,073 people shows a poor positive correlation between the proportion of Cajuns and percentage of households with 1 or more vehicles available in the United States with a correlation coefficient (R) of 0.182 and weighted average of 91.7%. Similarly, the statistical analysis conducted on geographies consisting of 193,195,026 people shows a moderate positive correlation between the proportion of Albanians and percentage of households with 1 or more vehicles available in the United States with a correlation coefficient (R) of 0.413 and weighted average of 84.4%, a difference of 8.6%.
1 or more Vehicles in Household Correlation Summary
| Measurement | Cajun | Albanian |
| Minimum | 78.8% | 68.5% |
| Maximum | 100.0% | 100.0% |
| Range | 21.2% | 31.5% |
| Mean | 93.2% | 90.8% |
| Median | 93.6% | 92.1% |
| Interquartile 25% (IQ1) | 91.0% | 87.5% |
| Interquartile 75% (IQ3) | 96.0% | 96.8% |
| Interquartile Range (IQR) | 4.9% | 9.3% |
| Standard Deviation (Sample) | 4.3% | 7.8% |
| Standard Deviation (Population) | 4.2% | 7.7% |
Similar Demographics by 1 or more Vehicles in Household
Demographics Similar to Cajuns by 1 or more Vehicles in Household
In terms of 1 or more vehicles in household, the demographic groups most similar to Cajuns are Polish (91.7%, a difference of 0.0%), Immigrants from Iran (91.7%, a difference of 0.010%), Lithuanian (91.7%, a difference of 0.020%), Palestinian (91.7%, a difference of 0.040%), and Immigrants from Lebanon (91.6%, a difference of 0.050%).
| Demographics | Rating | Rank | 1 or more Vehicles in Household |
| Immigrants | Laos | 99.8 /100 | #65 | Exceptional 91.8% |
| Canadians | 99.8 /100 | #66 | Exceptional 91.8% |
| Spaniards | 99.8 /100 | #67 | Exceptional 91.8% |
| Immigrants | Scotland | 99.7 /100 | #68 | Exceptional 91.8% |
| Palestinians | 99.7 /100 | #69 | Exceptional 91.7% |
| Lithuanians | 99.7 /100 | #70 | Exceptional 91.7% |
| Poles | 99.7 /100 | #71 | Exceptional 91.7% |
| Cajuns | 99.7 /100 | #72 | Exceptional 91.7% |
| Immigrants | Iran | 99.7 /100 | #73 | Exceptional 91.7% |
| Immigrants | Lebanon | 99.6 /100 | #74 | Exceptional 91.6% |
| Portuguese | 99.5 /100 | #75 | Exceptional 91.6% |
| Cubans | 99.5 /100 | #76 | Exceptional 91.5% |
| Immigrants | Philippines | 99.4 /100 | #77 | Exceptional 91.5% |
| Iranians | 99.4 /100 | #78 | Exceptional 91.5% |
| Immigrants | South Central Asia | 99.4 /100 | #79 | Exceptional 91.5% |
Demographics Similar to Albanians by 1 or more Vehicles in Household
In terms of 1 or more vehicles in household, the demographic groups most similar to Albanians are Immigrants from Israel (84.5%, a difference of 0.070%), Cypriot (84.4%, a difference of 0.070%), Cape Verdean (84.5%, a difference of 0.090%), Puerto Rican (84.6%, a difference of 0.20%), and U.S. Virgin Islander (84.6%, a difference of 0.24%).
| Demographics | Rating | Rank | 1 or more Vehicles in Household |
| Tohono O'odham | 0.0 /100 | #307 | Tragic 84.7% |
| Immigrants | Belize | 0.0 /100 | #308 | Tragic 84.7% |
| Immigrants | Haiti | 0.0 /100 | #309 | Tragic 84.7% |
| U.S. Virgin Islanders | 0.0 /100 | #310 | Tragic 84.6% |
| Puerto Ricans | 0.0 /100 | #311 | Tragic 84.6% |
| Cape Verdeans | 0.0 /100 | #312 | Tragic 84.5% |
| Immigrants | Israel | 0.0 /100 | #313 | Tragic 84.5% |
| Albanians | 0.0 /100 | #314 | Tragic 84.4% |
| Cypriots | 0.0 /100 | #315 | Tragic 84.4% |
| Alaska Natives | 0.0 /100 | #316 | Tragic 83.8% |
| Ghanaians | 0.0 /100 | #317 | Tragic 83.6% |
| Immigrants | Ghana | 0.0 /100 | #318 | Tragic 83.4% |
| Immigrants | Belarus | 0.0 /100 | #319 | Tragic 83.3% |
| Soviet Union | 0.0 /100 | #320 | Tragic 82.7% |
| Jamaicans | 0.0 /100 | #321 | Tragic 82.1% |