Assyrian/Chaldean/Syriac vs Albanian 1 or more Vehicles in Household
COMPARE
Assyrian/Chaldean/Syriac
Albanian
1 or more Vehicles in Household
1 or more Vehicles in Household Comparison
Assyrians/Chaldeans/Syriacs
Albanians
93.0%
1 OR MORE VEHICLES IN HOUSEHOLD
100.0/ 100
METRIC RATING
16th/ 347
METRIC RANK
84.4%
1 OR MORE VEHICLES IN HOUSEHOLD
0.0/ 100
METRIC RATING
314th/ 347
METRIC RANK
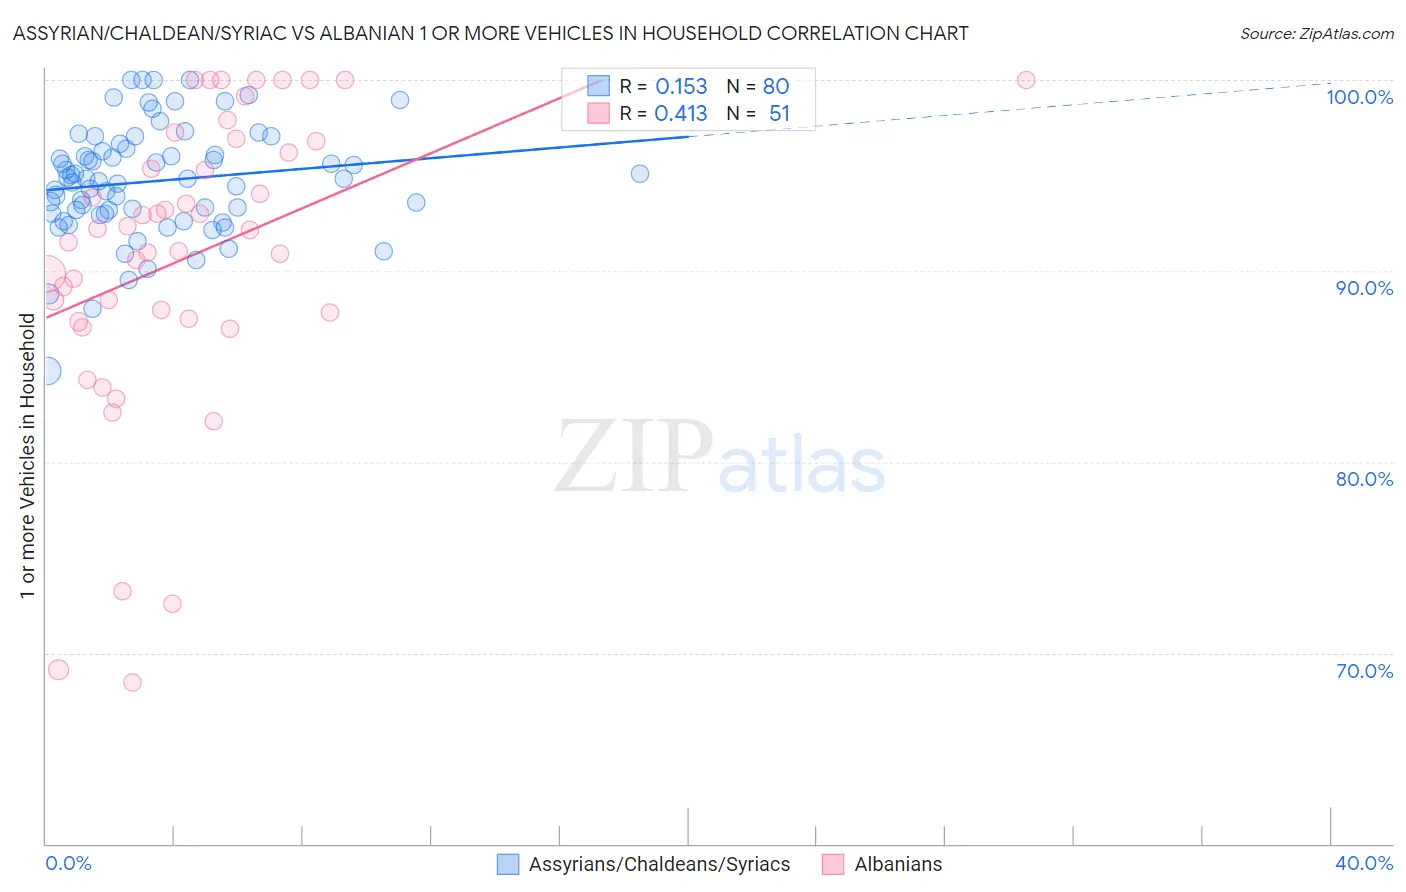
Assyrian/Chaldean/Syriac vs Albanian 1 or more Vehicles in Household Correlation Chart
The statistical analysis conducted on geographies consisting of 110,295,152 people shows a poor positive correlation between the proportion of Assyrians/Chaldeans/Syriacs and percentage of households with 1 or more vehicles available in the United States with a correlation coefficient (R) of 0.153 and weighted average of 93.0%. Similarly, the statistical analysis conducted on geographies consisting of 193,195,026 people shows a moderate positive correlation between the proportion of Albanians and percentage of households with 1 or more vehicles available in the United States with a correlation coefficient (R) of 0.413 and weighted average of 84.4%, a difference of 10.2%.
1 or more Vehicles in Household Correlation Summary
| Measurement | Assyrian/Chaldean/Syriac | Albanian |
| Minimum | 84.7% | 68.5% |
| Maximum | 100.0% | 100.0% |
| Range | 15.3% | 31.5% |
| Mean | 94.7% | 90.8% |
| Median | 94.8% | 92.1% |
| Interquartile 25% (IQ1) | 93.0% | 87.5% |
| Interquartile 75% (IQ3) | 96.4% | 96.8% |
| Interquartile Range (IQR) | 3.4% | 9.3% |
| Standard Deviation (Sample) | 2.9% | 7.8% |
| Standard Deviation (Population) | 2.9% | 7.7% |
Similar Demographics by 1 or more Vehicles in Household
Demographics Similar to Assyrians/Chaldeans/Syriacs by 1 or more Vehicles in Household
In terms of 1 or more vehicles in household, the demographic groups most similar to Assyrians/Chaldeans/Syriacs are Mexican (93.0%, a difference of 0.0%), Irish (93.1%, a difference of 0.020%), European (93.0%, a difference of 0.030%), White/Caucasian (93.1%, a difference of 0.060%), and Welsh (93.0%, a difference of 0.060%).
| Demographics | Rating | Rank | 1 or more Vehicles in Household |
| Scotch-Irish | 100.0 /100 | #9 | Exceptional 93.3% |
| Dutch | 100.0 /100 | #10 | Exceptional 93.3% |
| Czechs | 100.0 /100 | #11 | Exceptional 93.3% |
| Scandinavians | 100.0 /100 | #12 | Exceptional 93.1% |
| Whites/Caucasians | 100.0 /100 | #13 | Exceptional 93.1% |
| Irish | 100.0 /100 | #14 | Exceptional 93.1% |
| Mexicans | 100.0 /100 | #15 | Exceptional 93.0% |
| Assyrians/Chaldeans/Syriacs | 100.0 /100 | #16 | Exceptional 93.0% |
| Europeans | 100.0 /100 | #17 | Exceptional 93.0% |
| Welsh | 100.0 /100 | #18 | Exceptional 93.0% |
| Tongans | 100.0 /100 | #19 | Exceptional 92.9% |
| Arapaho | 100.0 /100 | #20 | Exceptional 92.7% |
| Ottawa | 100.0 /100 | #21 | Exceptional 92.7% |
| French | 100.0 /100 | #22 | Exceptional 92.7% |
| Nepalese | 100.0 /100 | #23 | Exceptional 92.6% |
Demographics Similar to Albanians by 1 or more Vehicles in Household
In terms of 1 or more vehicles in household, the demographic groups most similar to Albanians are Immigrants from Israel (84.5%, a difference of 0.070%), Cypriot (84.4%, a difference of 0.070%), Cape Verdean (84.5%, a difference of 0.090%), Puerto Rican (84.6%, a difference of 0.20%), and U.S. Virgin Islander (84.6%, a difference of 0.24%).
| Demographics | Rating | Rank | 1 or more Vehicles in Household |
| Tohono O'odham | 0.0 /100 | #307 | Tragic 84.7% |
| Immigrants | Belize | 0.0 /100 | #308 | Tragic 84.7% |
| Immigrants | Haiti | 0.0 /100 | #309 | Tragic 84.7% |
| U.S. Virgin Islanders | 0.0 /100 | #310 | Tragic 84.6% |
| Puerto Ricans | 0.0 /100 | #311 | Tragic 84.6% |
| Cape Verdeans | 0.0 /100 | #312 | Tragic 84.5% |
| Immigrants | Israel | 0.0 /100 | #313 | Tragic 84.5% |
| Albanians | 0.0 /100 | #314 | Tragic 84.4% |
| Cypriots | 0.0 /100 | #315 | Tragic 84.4% |
| Alaska Natives | 0.0 /100 | #316 | Tragic 83.8% |
| Ghanaians | 0.0 /100 | #317 | Tragic 83.6% |
| Immigrants | Ghana | 0.0 /100 | #318 | Tragic 83.4% |
| Immigrants | Belarus | 0.0 /100 | #319 | Tragic 83.3% |
| Soviet Union | 0.0 /100 | #320 | Tragic 82.7% |
| Jamaicans | 0.0 /100 | #321 | Tragic 82.1% |