Nigerian vs Albanian 1 or more Vehicles in Household
COMPARE
Nigerian
Albanian
1 or more Vehicles in Household
1 or more Vehicles in Household Comparison
Nigerians
Albanians
88.0%
1 OR MORE VEHICLES IN HOUSEHOLD
0.8/ 100
METRIC RATING
259th/ 347
METRIC RANK
84.4%
1 OR MORE VEHICLES IN HOUSEHOLD
0.0/ 100
METRIC RATING
314th/ 347
METRIC RANK
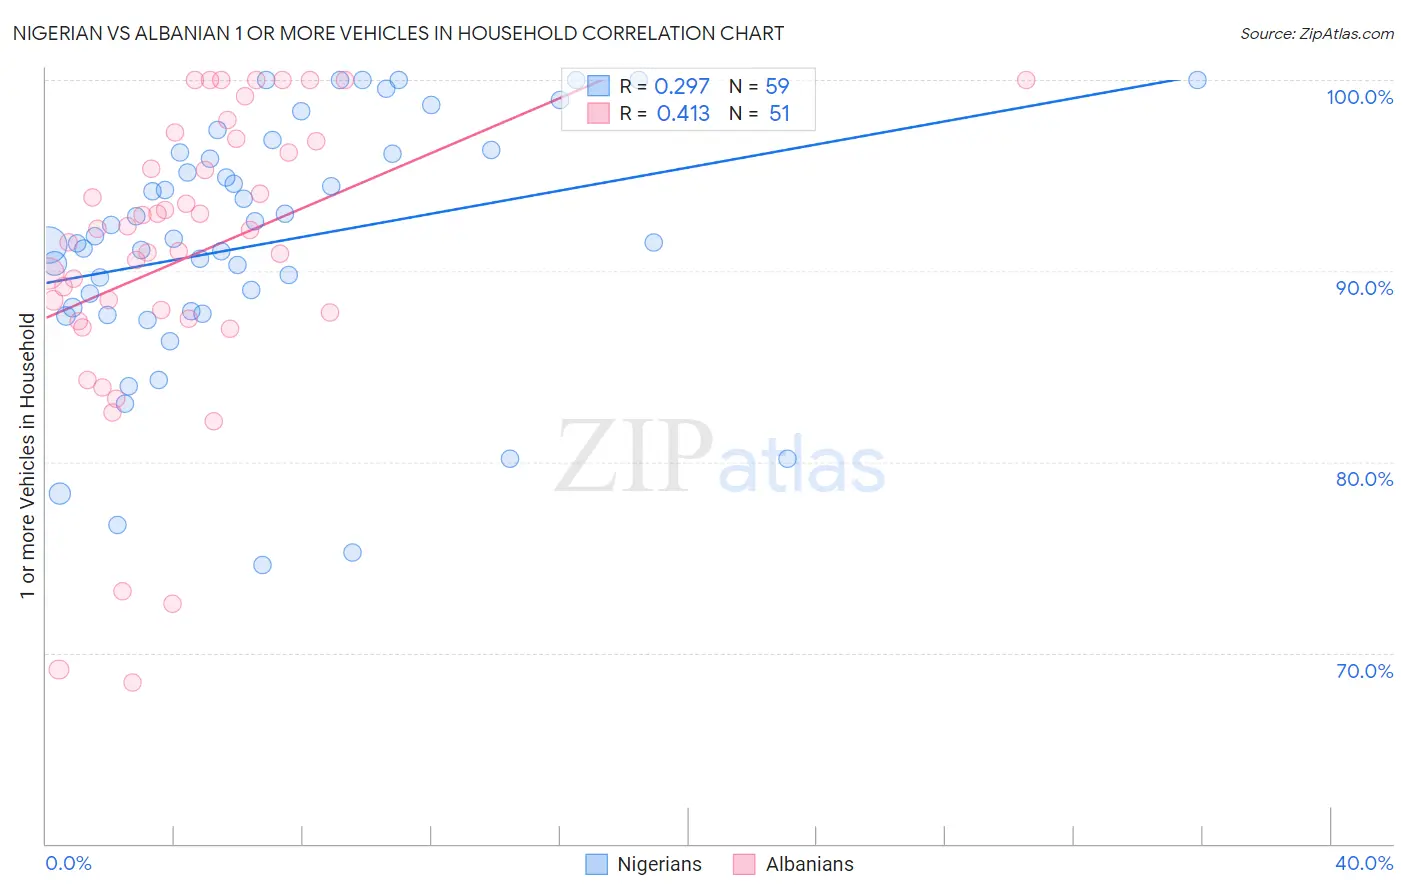
Nigerian vs Albanian 1 or more Vehicles in Household Correlation Chart
The statistical analysis conducted on geographies consisting of 332,510,990 people shows a weak positive correlation between the proportion of Nigerians and percentage of households with 1 or more vehicles available in the United States with a correlation coefficient (R) of 0.297 and weighted average of 88.0%. Similarly, the statistical analysis conducted on geographies consisting of 193,195,026 people shows a moderate positive correlation between the proportion of Albanians and percentage of households with 1 or more vehicles available in the United States with a correlation coefficient (R) of 0.413 and weighted average of 84.4%, a difference of 4.2%.
1 or more Vehicles in Household Correlation Summary
| Measurement | Nigerian | Albanian |
| Minimum | 74.6% | 68.5% |
| Maximum | 100.0% | 100.0% |
| Range | 25.4% | 31.5% |
| Mean | 91.4% | 90.8% |
| Median | 91.7% | 92.1% |
| Interquartile 25% (IQ1) | 87.9% | 87.5% |
| Interquartile 75% (IQ3) | 96.2% | 96.8% |
| Interquartile Range (IQR) | 8.3% | 9.3% |
| Standard Deviation (Sample) | 6.5% | 7.8% |
| Standard Deviation (Population) | 6.5% | 7.7% |
Similar Demographics by 1 or more Vehicles in Household
Demographics Similar to Nigerians by 1 or more Vehicles in Household
In terms of 1 or more vehicles in household, the demographic groups most similar to Nigerians are Liberian (88.0%, a difference of 0.030%), South American Indian (88.0%, a difference of 0.030%), Immigrants from Latvia (88.1%, a difference of 0.040%), Colombian (88.0%, a difference of 0.040%), and Honduran (88.1%, a difference of 0.070%).
| Demographics | Rating | Rank | 1 or more Vehicles in Household |
| Immigrants | Uruguay | 1.1 /100 | #252 | Tragic 88.1% |
| Hondurans | 1.0 /100 | #253 | Tragic 88.1% |
| Haitians | 0.9 /100 | #254 | Tragic 88.1% |
| Immigrants | Latvia | 0.9 /100 | #255 | Tragic 88.1% |
| Colombians | 0.9 /100 | #256 | Tragic 88.0% |
| Liberians | 0.9 /100 | #257 | Tragic 88.0% |
| South American Indians | 0.9 /100 | #258 | Tragic 88.0% |
| Nigerians | 0.8 /100 | #259 | Tragic 88.0% |
| Macedonians | 0.6 /100 | #260 | Tragic 87.9% |
| Immigrants | Switzerland | 0.6 /100 | #261 | Tragic 87.9% |
| Sub-Saharan Africans | 0.5 /100 | #262 | Tragic 87.9% |
| Immigrants | Egypt | 0.5 /100 | #263 | Tragic 87.8% |
| Immigrants | Liberia | 0.4 /100 | #264 | Tragic 87.8% |
| Africans | 0.4 /100 | #265 | Tragic 87.8% |
| Israelis | 0.3 /100 | #266 | Tragic 87.7% |
Demographics Similar to Albanians by 1 or more Vehicles in Household
In terms of 1 or more vehicles in household, the demographic groups most similar to Albanians are Immigrants from Israel (84.5%, a difference of 0.070%), Cypriot (84.4%, a difference of 0.070%), Cape Verdean (84.5%, a difference of 0.090%), Puerto Rican (84.6%, a difference of 0.20%), and U.S. Virgin Islander (84.6%, a difference of 0.24%).
| Demographics | Rating | Rank | 1 or more Vehicles in Household |
| Tohono O'odham | 0.0 /100 | #307 | Tragic 84.7% |
| Immigrants | Belize | 0.0 /100 | #308 | Tragic 84.7% |
| Immigrants | Haiti | 0.0 /100 | #309 | Tragic 84.7% |
| U.S. Virgin Islanders | 0.0 /100 | #310 | Tragic 84.6% |
| Puerto Ricans | 0.0 /100 | #311 | Tragic 84.6% |
| Cape Verdeans | 0.0 /100 | #312 | Tragic 84.5% |
| Immigrants | Israel | 0.0 /100 | #313 | Tragic 84.5% |
| Albanians | 0.0 /100 | #314 | Tragic 84.4% |
| Cypriots | 0.0 /100 | #315 | Tragic 84.4% |
| Alaska Natives | 0.0 /100 | #316 | Tragic 83.8% |
| Ghanaians | 0.0 /100 | #317 | Tragic 83.6% |
| Immigrants | Ghana | 0.0 /100 | #318 | Tragic 83.4% |
| Immigrants | Belarus | 0.0 /100 | #319 | Tragic 83.3% |
| Soviet Union | 0.0 /100 | #320 | Tragic 82.7% |
| Jamaicans | 0.0 /100 | #321 | Tragic 82.1% |