Immigrants from Spain vs Albanian 1 or more Vehicles in Household
COMPARE
Immigrants from Spain
Albanian
1 or more Vehicles in Household
1 or more Vehicles in Household Comparison
Immigrants from Spain
Albanians
85.8%
1 OR MORE VEHICLES IN HOUSEHOLD
0.0/ 100
METRIC RATING
296th/ 347
METRIC RANK
84.4%
1 OR MORE VEHICLES IN HOUSEHOLD
0.0/ 100
METRIC RATING
314th/ 347
METRIC RANK
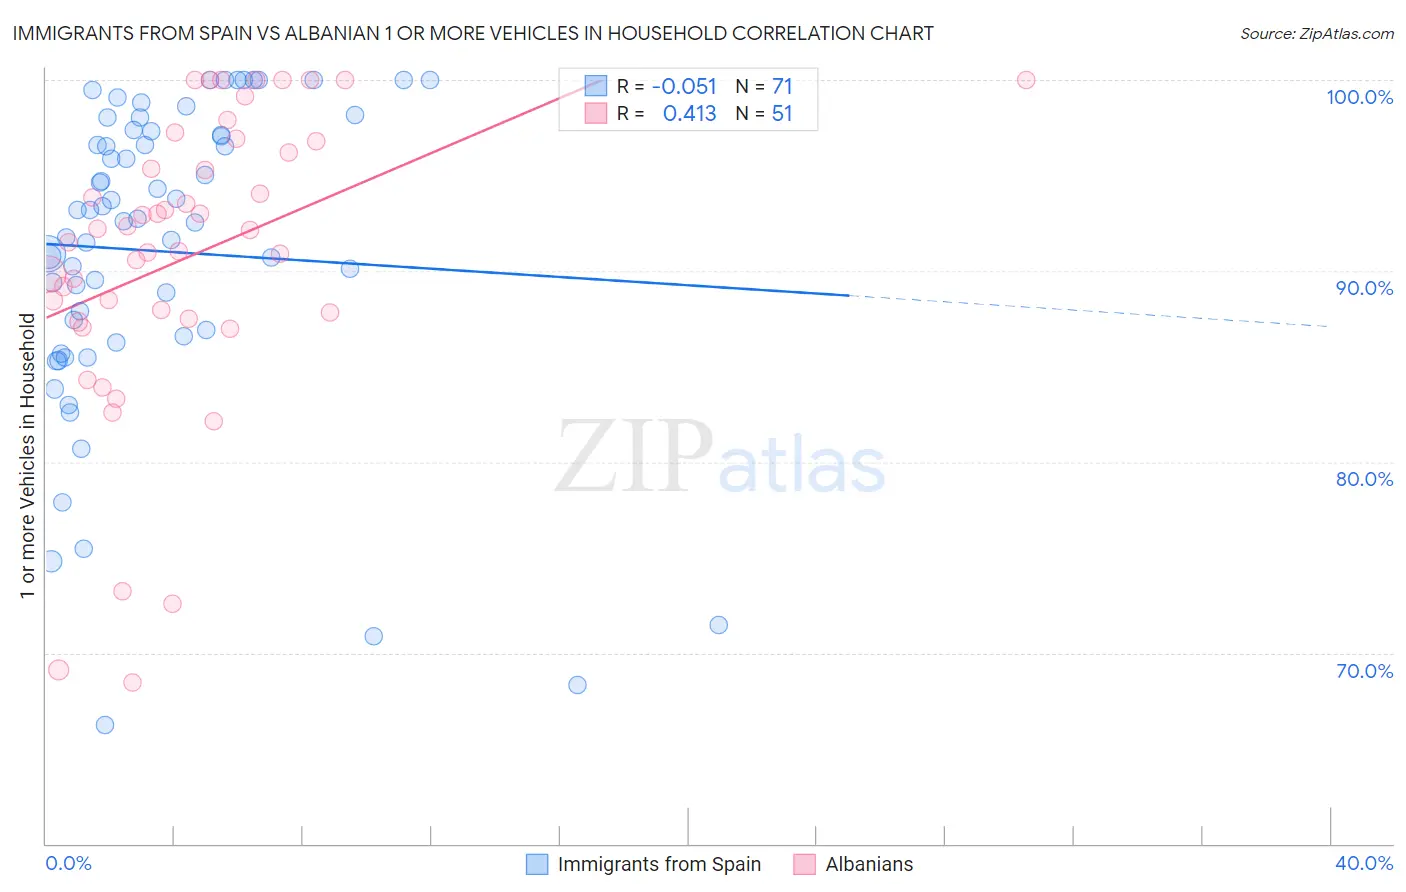
Immigrants from Spain vs Albanian 1 or more Vehicles in Household Correlation Chart
The statistical analysis conducted on geographies consisting of 239,528,029 people shows a slight negative correlation between the proportion of Immigrants from Spain and percentage of households with 1 or more vehicles available in the United States with a correlation coefficient (R) of -0.051 and weighted average of 85.8%. Similarly, the statistical analysis conducted on geographies consisting of 193,195,026 people shows a moderate positive correlation between the proportion of Albanians and percentage of households with 1 or more vehicles available in the United States with a correlation coefficient (R) of 0.413 and weighted average of 84.4%, a difference of 1.6%.
1 or more Vehicles in Household Correlation Summary
| Measurement | Immigrants from Spain | Albanian |
| Minimum | 66.2% | 68.5% |
| Maximum | 100.0% | 100.0% |
| Range | 33.8% | 31.5% |
| Mean | 91.0% | 90.8% |
| Median | 92.8% | 92.1% |
| Interquartile 25% (IQ1) | 86.6% | 87.5% |
| Interquartile 75% (IQ3) | 97.3% | 96.8% |
| Interquartile Range (IQR) | 10.8% | 9.3% |
| Standard Deviation (Sample) | 8.2% | 7.8% |
| Standard Deviation (Population) | 8.1% | 7.7% |
Demographics Similar to Immigrants from Spain and Albanians by 1 or more Vehicles in Household
In terms of 1 or more vehicles in household, the demographic groups most similar to Immigrants from Spain are Immigrants from Jamaica (85.8%, a difference of 0.030%), Paraguayan (85.7%, a difference of 0.090%), Belizean (85.7%, a difference of 0.17%), Yuman (85.5%, a difference of 0.41%), and Immigrants from Russia (85.4%, a difference of 0.42%). Similarly, the demographic groups most similar to Albanians are Immigrants from Israel (84.5%, a difference of 0.070%), Cypriot (84.4%, a difference of 0.070%), Cape Verdean (84.5%, a difference of 0.090%), Puerto Rican (84.6%, a difference of 0.20%), and U.S. Virgin Islander (84.6%, a difference of 0.24%).
| Demographics | Rating | Rank | 1 or more Vehicles in Household |
| Immigrants | Jamaica | 0.0 /100 | #295 | Tragic 85.8% |
| Immigrants | Spain | 0.0 /100 | #296 | Tragic 85.8% |
| Paraguayans | 0.0 /100 | #297 | Tragic 85.7% |
| Belizeans | 0.0 /100 | #298 | Tragic 85.7% |
| Yuman | 0.0 /100 | #299 | Tragic 85.5% |
| Immigrants | Russia | 0.0 /100 | #300 | Tragic 85.4% |
| Immigrants | Panama | 0.0 /100 | #301 | Tragic 85.4% |
| Moroccans | 0.0 /100 | #302 | Tragic 85.4% |
| Immigrants | Greece | 0.0 /100 | #303 | Tragic 85.4% |
| Immigrants | Ukraine | 0.0 /100 | #304 | Tragic 85.2% |
| Immigrants | China | 0.0 /100 | #305 | Tragic 84.9% |
| Immigrants | Western Africa | 0.0 /100 | #306 | Tragic 84.9% |
| Tohono O'odham | 0.0 /100 | #307 | Tragic 84.7% |
| Immigrants | Belize | 0.0 /100 | #308 | Tragic 84.7% |
| Immigrants | Haiti | 0.0 /100 | #309 | Tragic 84.7% |
| U.S. Virgin Islanders | 0.0 /100 | #310 | Tragic 84.6% |
| Puerto Ricans | 0.0 /100 | #311 | Tragic 84.6% |
| Cape Verdeans | 0.0 /100 | #312 | Tragic 84.5% |
| Immigrants | Israel | 0.0 /100 | #313 | Tragic 84.5% |
| Albanians | 0.0 /100 | #314 | Tragic 84.4% |
| Cypriots | 0.0 /100 | #315 | Tragic 84.4% |