Immigrants from Italy vs Immigrants from Indonesia 3 or more Vehicles in Household
COMPARE
Immigrants from Italy
Immigrants from Indonesia
3 or more Vehicles in Household
3 or more Vehicles in Household Comparison
Immigrants from Italy
Immigrants from Indonesia
18.7%
3 OR MORE VEHICLES IN HOUSEHOLD
10.2/ 100
METRIC RATING
217th/ 347
METRIC RANK
21.1%
3 OR MORE VEHICLES IN HOUSEHOLD
98.8/ 100
METRIC RATING
93rd/ 347
METRIC RANK
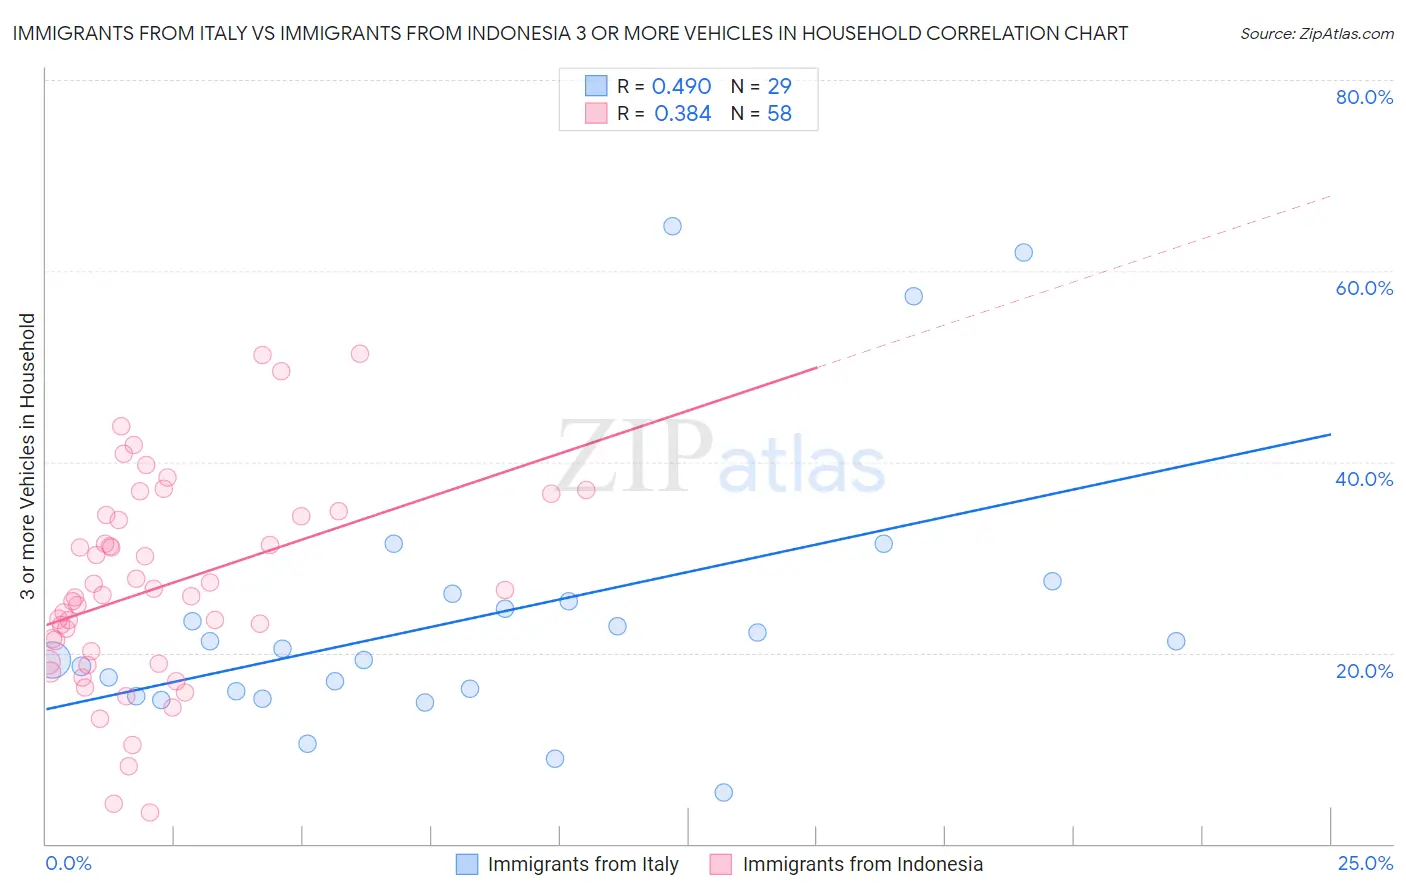
Immigrants from Italy vs Immigrants from Indonesia 3 or more Vehicles in Household Correlation Chart
The statistical analysis conducted on geographies consisting of 324,064,061 people shows a moderate positive correlation between the proportion of Immigrants from Italy and percentage of households with 3 or more vehicles available in the United States with a correlation coefficient (R) of 0.490 and weighted average of 18.7%. Similarly, the statistical analysis conducted on geographies consisting of 215,673,146 people shows a mild positive correlation between the proportion of Immigrants from Indonesia and percentage of households with 3 or more vehicles available in the United States with a correlation coefficient (R) of 0.384 and weighted average of 21.1%, a difference of 12.9%.
3 or more Vehicles in Household Correlation Summary
| Measurement | Immigrants from Italy | Immigrants from Indonesia |
| Minimum | 5.4% | 3.3% |
| Maximum | 64.7% | 51.4% |
| Range | 59.3% | 48.1% |
| Mean | 23.8% | 26.9% |
| Median | 20.4% | 26.0% |
| Interquartile 25% (IQ1) | 15.7% | 19.0% |
| Interquartile 75% (IQ3) | 25.7% | 34.3% |
| Interquartile Range (IQR) | 10.0% | 15.3% |
| Standard Deviation (Sample) | 14.3% | 10.7% |
| Standard Deviation (Population) | 14.1% | 10.6% |
Similar Demographics by 3 or more Vehicles in Household
Demographics Similar to Immigrants from Italy by 3 or more Vehicles in Household
In terms of 3 or more vehicles in household, the demographic groups most similar to Immigrants from Italy are Immigrants from Nigeria (18.7%, a difference of 0.020%), Eastern European (18.7%, a difference of 0.080%), Immigrants from Sierra Leone (18.7%, a difference of 0.13%), Panamanian (18.8%, a difference of 0.28%), and Immigrants from Cuba (18.8%, a difference of 0.28%).
| Demographics | Rating | Rank | 3 or more Vehicles in Household |
| Bulgarians | 13.1 /100 | #210 | Poor 18.8% |
| Immigrants | Kenya | 12.4 /100 | #211 | Poor 18.8% |
| Panamanians | 11.6 /100 | #212 | Poor 18.8% |
| Immigrants | Cuba | 11.6 /100 | #213 | Poor 18.8% |
| Immigrants | Sierra Leone | 10.8 /100 | #214 | Poor 18.7% |
| Eastern Europeans | 10.6 /100 | #215 | Poor 18.7% |
| Immigrants | Nigeria | 10.3 /100 | #216 | Poor 18.7% |
| Immigrants | Italy | 10.2 /100 | #217 | Poor 18.7% |
| Immigrants | Portugal | 8.9 /100 | #218 | Tragic 18.6% |
| Immigrants | Armenia | 8.6 /100 | #219 | Tragic 18.6% |
| Nigerians | 7.9 /100 | #220 | Tragic 18.6% |
| Immigrants | Poland | 7.5 /100 | #221 | Tragic 18.6% |
| Belizeans | 7.3 /100 | #222 | Tragic 18.6% |
| Immigrants | Czechoslovakia | 5.9 /100 | #223 | Tragic 18.5% |
| Immigrants | Argentina | 5.6 /100 | #224 | Tragic 18.5% |
Demographics Similar to Immigrants from Indonesia by 3 or more Vehicles in Household
In terms of 3 or more vehicles in household, the demographic groups most similar to Immigrants from Indonesia are Apache (21.2%, a difference of 0.20%), Immigrants from Cambodia (21.1%, a difference of 0.23%), Belgian (21.2%, a difference of 0.28%), Pakistani (21.0%, a difference of 0.37%), and Cree (21.0%, a difference of 0.46%).
| Demographics | Rating | Rank | 3 or more Vehicles in Household |
| Delaware | 99.6 /100 | #86 | Exceptional 21.5% |
| Immigrants | Azores | 99.5 /100 | #87 | Exceptional 21.5% |
| French | 99.4 /100 | #88 | Exceptional 21.4% |
| Marshallese | 99.2 /100 | #89 | Exceptional 21.3% |
| Immigrants | Afghanistan | 99.1 /100 | #90 | Exceptional 21.2% |
| Belgians | 98.9 /100 | #91 | Exceptional 21.2% |
| Apache | 98.9 /100 | #92 | Exceptional 21.2% |
| Immigrants | Indonesia | 98.8 /100 | #93 | Exceptional 21.1% |
| Immigrants | Cambodia | 98.6 /100 | #94 | Exceptional 21.1% |
| Pakistanis | 98.5 /100 | #95 | Exceptional 21.0% |
| Cree | 98.4 /100 | #96 | Exceptional 21.0% |
| Canadians | 98.3 /100 | #97 | Exceptional 21.0% |
| Hmong | 98.2 /100 | #98 | Exceptional 21.0% |
| Alaska Natives | 98.2 /100 | #99 | Exceptional 21.0% |
| Comanche | 98.2 /100 | #100 | Exceptional 21.0% |