Immigrants from Italy vs Immigrants from Indonesia Disability Age 65 to 74

COMPARE

Immigrants from Italy
Race
Ancestry
AfghanAfricanAlaska NativeAlaskan AthabascanAlbanianAleutAlsatianAmericanApacheArabArapahoArgentineanArmenianAssyrian/Chaldean/SyriacAustralianAustrianBahamianBangladeshiBarbadianBasqueBelgianBelizeanBermudanBhutaneseBlackfeetBolivianBrazilianBritishBritish West IndianBulgarianBurmeseCajunCambodianCanadianCape VerdeanCarpatho RusynCelticCentral AmericanCentral American IndianCherokeeCheyenneChickasawChileanChineseChippewaChoctawColombianColvilleComancheCosta RicanCreeCreekCroatianCrowCubanCypriotCzechCzechoslovakianDanishDelawareDominicanDutchDutch West IndianEastern EuropeanEcuadorianEgyptianEnglishEstonianEthiopianEuropeanFijianFilipinoFinnishFrenchFrench American IndianFrench CanadianGermanGerman RussianGhanaianGreekGuamanian/ChamorroGuatemalanGuyaneseHaitianHmongHonduranHopiHoumaHungarianIcelanderIndian (Asian)IndonesianInupiatIranianIraqiIrishIroquoisIsraeliItalianJamaicanJapaneseJordanianKenyanKiowaKoreanLaotianLatvianLebaneseLiberianLithuanianLumbeeLuxembourgerMacedonianMalaysianMalteseMarshalleseMenomineeMexicanMexican American IndianMongolianMoroccanNative HawaiianNavajoNepaleseNew ZealanderNicaraguanNigerianNorthern EuropeanNorwegianOkinawanOsageOttawaPaiutePakistaniPalestinianPanamanianParaguayanPennsylvania GermanPeruvianPimaPolishPortuguesePotawatomiPuebloPuerto RicanPuget Sound SalishRomanianRussianSalvadoranSamoanScandinavianScotch-IrishScottishSeminoleSenegaleseSerbianShoshoneSierra LeoneanSiouxSlavicSlovakSloveneSomaliSouth AfricanSouth AmericanSouth American IndianSoviet UnionSpaniardSpanishSpanish AmericanSpanish American IndianSri LankanSubsaharan AfricanSudaneseSwedishSwissSyrianTaiwaneseThaiTlingit-HaidaTohono O'OdhamTonganTrinidadian and TobagonianTsimshianTurkishU.S. Virgin IslanderUgandanUkrainianUruguayanUteVenezuelanVietnameseWelshWest IndianYakamaYaquiYugoslavianYumanYup'ikZimbabwean
Immigration
NonimmigrantsImmigrantsAfghanistanAfricaAlbaniaArgentinaArmeniaAsiaAustraliaAustriaBahamasBangladeshBarbadosBelarusBelgiumBelizeBoliviaBosnia and HerzegovinaBrazilBulgariaBurma/MyanmarCabo VerdeCambodiaCameroonCanadaCaribbeanCentral AmericaChileChinaColombiaCongoCosta RicaCroatiaCubaCzechoslovakiaDenmarkDominicaDominican RepublicEastern AfricaEastern AsiaEastern EuropeEcuadorEgyptEl SalvadorEnglandEritreaEthiopiaEuropeFijiFranceGermanyGhanaGreeceGrenadaGuatemalaGuyanaHaitiHondurasHong KongHungaryIndiaIranIraqIrelandIsraelItalyJamaicaJapanJordanKazakhstanKenyaKoreaKuwaitLaosLatin AmericaLatviaLebanonLiberiaLithuaniaMalaysiaMexicoMicronesiaMiddle AfricaMoldovaMoroccoNepalNetherlandsNicaraguaNigeriaNorth AmericaNorth MacedoniaNorthern AfricaNorthern EuropeNorwayOceaniaPakistanPanamaPeruPhilippinesPolandPortugalRomaniaRussiaSaudi ArabiaScotlandSenegalSerbiaSierra LeoneSingaporeSomaliaSouth AfricaSouth AmericaSouth Central AsiaSouth Eastern AsiaSouthern EuropeSpainSri LankaSt. Vincent and the GrenadinesSudanSwedenSwitzerlandSyriaTaiwanThailandTrinidad and TobagoTurkeyUgandaUkraineUruguayUzbekistanVenezuelaVietnamWest IndiesWestern AfricaWestern AsiaWestern EuropeYemenZaireZimbabweAzores
Immigrants from Indonesia
Race
Ancestry
AfghanAfricanAlaska NativeAlaskan AthabascanAlbanianAleutAlsatianAmericanApacheArabArapahoArgentineanArmenianAssyrian/Chaldean/SyriacAustralianAustrianBahamianBangladeshiBarbadianBasqueBelgianBelizeanBermudanBhutaneseBlackfeetBolivianBrazilianBritishBritish West IndianBulgarianBurmeseCajunCambodianCanadianCape VerdeanCarpatho RusynCelticCentral AmericanCentral American IndianCherokeeCheyenneChickasawChileanChineseChippewaChoctawColombianColvilleComancheCosta RicanCreeCreekCroatianCrowCubanCypriotCzechCzechoslovakianDanishDelawareDominicanDutchDutch West IndianEastern EuropeanEcuadorianEgyptianEnglishEstonianEthiopianEuropeanFijianFilipinoFinnishFrenchFrench American IndianFrench CanadianGermanGerman RussianGhanaianGreekGuamanian/ChamorroGuatemalanGuyaneseHaitianHmongHonduranHopiHoumaHungarianIcelanderIndian (Asian)IndonesianInupiatIranianIraqiIrishIroquoisIsraeliItalianJamaicanJapaneseJordanianKenyanKiowaKoreanLaotianLatvianLebaneseLiberianLithuanianLumbeeLuxembourgerMacedonianMalaysianMalteseMarshalleseMenomineeMexicanMexican American IndianMongolianMoroccanNative HawaiianNavajoNepaleseNew ZealanderNicaraguanNigerianNorthern EuropeanNorwegianOkinawanOsageOttawaPaiutePakistaniPalestinianPanamanianParaguayanPennsylvania GermanPeruvianPimaPolishPortuguesePotawatomiPuebloPuerto RicanPuget Sound SalishRomanianRussianSalvadoranSamoanScandinavianScotch-IrishScottishSeminoleSenegaleseSerbianShoshoneSierra LeoneanSiouxSlavicSlovakSloveneSomaliSouth AfricanSouth AmericanSouth American IndianSoviet UnionSpaniardSpanishSpanish AmericanSpanish American IndianSri LankanSubsaharan AfricanSudaneseSwedishSwissSyrianTaiwaneseThaiTlingit-HaidaTohono O'OdhamTonganTrinidadian and TobagonianTsimshianTurkishU.S. Virgin IslanderUgandanUkrainianUruguayanUteVenezuelanVietnameseWelshWest IndianYakamaYaquiYugoslavianYumanYup'ikZimbabwean
Immigration
NonimmigrantsImmigrantsAfghanistanAfricaAlbaniaArgentinaArmeniaAsiaAustraliaAustriaBahamasBangladeshBarbadosBelarusBelgiumBelizeBoliviaBosnia and HerzegovinaBrazilBulgariaBurma/MyanmarCabo VerdeCambodiaCameroonCanadaCaribbeanCentral AmericaChileChinaColombiaCongoCosta RicaCroatiaCubaCzechoslovakiaDenmarkDominicaDominican RepublicEastern AfricaEastern AsiaEastern EuropeEcuadorEgyptEl SalvadorEnglandEritreaEthiopiaEuropeFijiFranceGermanyGhanaGreeceGrenadaGuatemalaGuyanaHaitiHondurasHong KongHungaryIndiaIndonesiaIranIraqIrelandIsraelJamaicaJapanJordanKazakhstanKenyaKoreaKuwaitLaosLatin AmericaLatviaLebanonLiberiaLithuaniaMalaysiaMexicoMicronesiaMiddle AfricaMoldovaMoroccoNepalNetherlandsNicaraguaNigeriaNorth AmericaNorth MacedoniaNorthern AfricaNorthern EuropeNorwayOceaniaPakistanPanamaPeruPhilippinesPolandPortugalRomaniaRussiaSaudi ArabiaScotlandSenegalSerbiaSierra LeoneSingaporeSomaliaSouth AfricaSouth AmericaSouth Central AsiaSouth Eastern AsiaSouthern EuropeSpainSri LankaSt. Vincent and the GrenadinesSudanSwedenSwitzerlandSyriaTaiwanThailandTrinidad and TobagoTurkeyUgandaUkraineUruguayUzbekistanVenezuelaVietnamWest IndiesWestern AfricaWestern AsiaWestern EuropeYemenZaireZimbabweAzores
Disability Age 65 to 74
Income
Poverty
Unemployment
Labor Participation
Family Structure
Vehicle Availability
Education Level
Disability

Disability Age 65 to 74 Comparison

Immigrants from Italy

Immigrants from Indonesia

Exceptional
Exceptional
21.5%
DISABILITY AGE 65 TO 74
99.6/ 100
METRIC RATING
54th/ 347
METRIC RANK
21.9%
DISABILITY AGE 65 TO 74
98.7/ 100
METRIC RATING
82nd/ 347
METRIC RANK

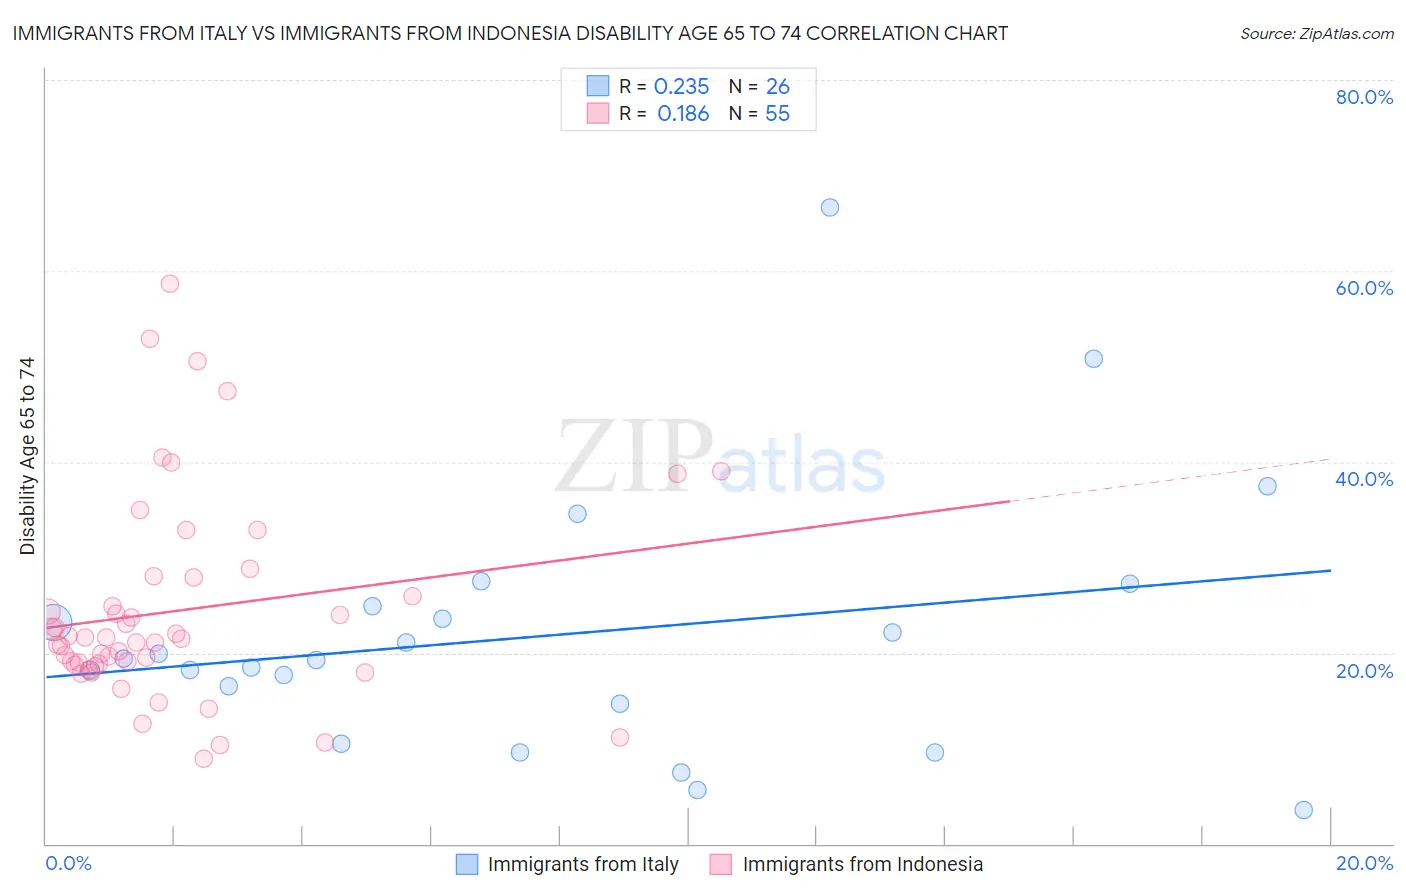
Immigrants from Italy vs Immigrants from Indonesia Disability Age 65 to 74 Correlation Chart

The statistical analysis conducted on geographies consisting of 323,882,260 people shows a weak positive correlation between the proportion of Immigrants from Italy and percentage of population with a disability between the ages 65 and 75 in the United States with a correlation coefficient (R) of 0.235 and weighted average of 21.5%. Similarly, the statistical analysis conducted on geographies consisting of 215,523,234 people shows a poor positive correlation between the proportion of Immigrants from Indonesia and percentage of population with a disability between the ages 65 and 75 in the United States with a correlation coefficient (R) of 0.186 and weighted average of 21.9%, a difference of 1.7%.
Immigrants from Italy vs Immigrants from Indonesia Disability Age 65 to 74

Disability Age 65 to 74 Correlation Summary

MeasurementImmigrants from ItalyImmigrants from Indonesia
Minimum3.5%8.9%
Maximum66.7%58.7%
Range63.2%49.8%
Mean21.8%24.4%
Median19.3%21.4%
Interquartile 25% (IQ1)14.7%18.8%
Interquartile 75% (IQ3)24.9%27.9%
Interquartile Range (IQR)10.2%9.2%
Standard Deviation (Sample)13.7%10.7%
Standard Deviation (Population)13.5%10.6%

Similar Demographics by Disability Age 65 to 74

Demographics Similar to Immigrants from Italy by Disability Age 65 to 74

In terms of disability age 65 to 74, the demographic groups most similar to Immigrants from Italy are Bhutanese (21.5%, a difference of 0.010%), Immigrants from France (21.5%, a difference of 0.020%), Immigrants from Romania (21.5%, a difference of 0.080%), Immigrants from Denmark (21.5%, a difference of 0.10%), and Immigrants from Asia (21.5%, a difference of 0.19%).
DemographicsRating | RankDisability Age 65 to 74
Immigrants | Bulgaria
99.7
/100
|
#47
Exceptional
21.4%
Lithuanians
99.7
/100
|
#48
Exceptional
21.4%
Luxembourgers
99.7
/100
|
#49
Exceptional
21.4%
Immigrants | Malaysia
99.7
/100
|
#50
Exceptional
21.4%
Immigrants | Serbia
99.6
/100
|
#51
Exceptional
21.4%
Immigrants | France
99.6
/100
|
#52
Exceptional
21.5%
Bhutanese
99.6
/100
|
#53
Exceptional
21.5%
Immigrants | Italy
99.6
/100
|
#54
Exceptional
21.5%
Immigrants | Romania
99.5
/100
|
#55
Exceptional
21.5%
Immigrants | Denmark
99.5
/100
|
#56
Exceptional
21.5%
Immigrants | Asia
99.5
/100
|
#57
Exceptional
21.5%
Immigrants | Pakistan
99.5
/100
|
#58
Exceptional
21.5%
Zimbabweans
99.5
/100
|
#59
Exceptional
21.5%
Immigrants | North Macedonia
99.5
/100
|
#60
Exceptional
21.6%
Egyptians
99.5
/100
|
#61
Exceptional
21.6%

Demographics Similar to Immigrants from Indonesia by Disability Age 65 to 74

In terms of disability age 65 to 74, the demographic groups most similar to Immigrants from Indonesia are Immigrants from Brazil (21.9%, a difference of 0.17%), Immigrants from Spain (21.9%, a difference of 0.19%), Croatian (21.8%, a difference of 0.26%), Immigrants from Lebanon (21.9%, a difference of 0.29%), and Immigrants from Norway (21.8%, a difference of 0.33%).
DemographicsRating | RankDisability Age 65 to 74
Mongolians
99.0
/100
|
#75
Exceptional
21.8%
Greeks
99.0
/100
|
#76
Exceptional
21.8%
Immigrants | Poland
99.0
/100
|
#77
Exceptional
21.8%
Immigrants | Eastern Europe
99.0
/100
|
#78
Exceptional
21.8%
Venezuelans
99.0
/100
|
#79
Exceptional
21.8%
Immigrants | Norway
98.9
/100
|
#80
Exceptional
21.8%
Croatians
98.9
/100
|
#81
Exceptional
21.8%
Immigrants | Indonesia
98.7
/100
|
#82
Exceptional
21.9%
Immigrants | Brazil
98.5
/100
|
#83
Exceptional
21.9%
Immigrants | Spain
98.5
/100
|
#84
Exceptional
21.9%
Immigrants | Lebanon
98.4
/100
|
#85
Exceptional
21.9%
South Africans
98.4
/100
|
#86
Exceptional
21.9%
Australians
98.0
/100
|
#87
Exceptional
22.0%
Immigrants | Netherlands
97.9
/100
|
#88
Exceptional
22.0%
Immigrants | Kuwait
97.9
/100
|
#89
Exceptional
22.0%