Immigrants from Italy vs Assyrian/Chaldean/Syriac Householder Income Over 65 years
COMPARE
Immigrants from Italy
Assyrian/Chaldean/Syriac
Householder Income Over 65 years
Householder Income Over 65 years Comparison
Immigrants from Italy
Assyrians/Chaldeans/Syriacs
$64,065
HOUSEHOLDER INCOME OVER 65 YEARS
96.2/ 100
METRIC RATING
101st/ 347
METRIC RANK
$64,108
HOUSEHOLDER INCOME OVER 65 YEARS
96.4/ 100
METRIC RATING
99th/ 347
METRIC RANK
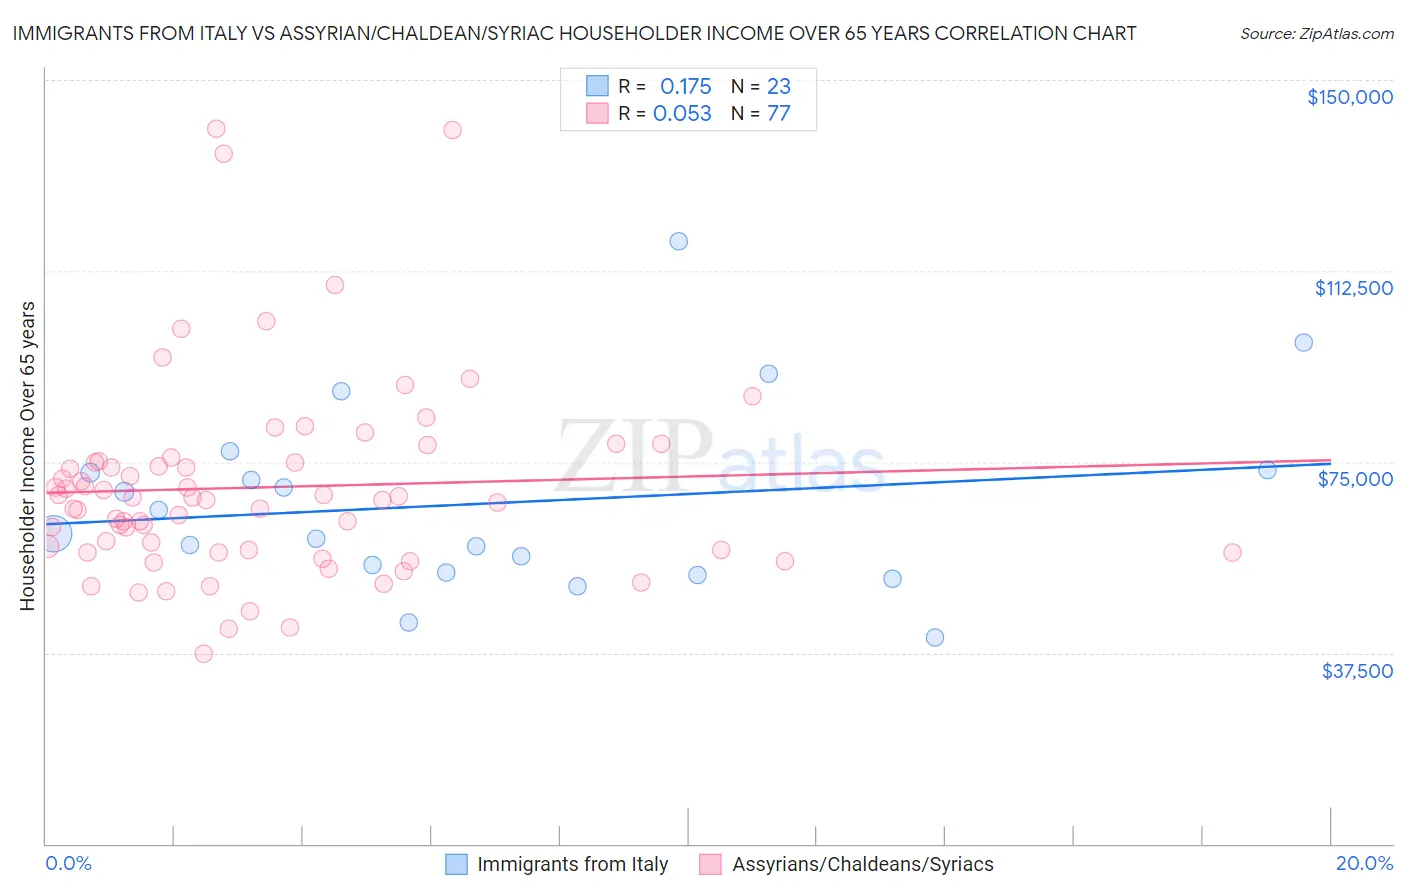
Immigrants from Italy vs Assyrian/Chaldean/Syriac Householder Income Over 65 years Correlation Chart
The statistical analysis conducted on geographies consisting of 323,658,132 people shows a poor positive correlation between the proportion of Immigrants from Italy and household income with householder over the age of 65 in the United States with a correlation coefficient (R) of 0.175 and weighted average of $64,065. Similarly, the statistical analysis conducted on geographies consisting of 110,223,664 people shows a slight positive correlation between the proportion of Assyrians/Chaldeans/Syriacs and household income with householder over the age of 65 in the United States with a correlation coefficient (R) of 0.053 and weighted average of $64,108, a difference of 0.070%.
Householder Income Over 65 years Correlation Summary
| Measurement | Immigrants from Italy | Assyrian/Chaldean/Syriac |
| Minimum | $40,625 | $37,310 |
| Maximum | $118,263 | $140,431 |
| Range | $77,638 | $103,121 |
| Mean | $66,915 | $70,014 |
| Median | $60,782 | $67,459 |
| Interquartile 25% (IQ1) | $53,273 | $57,422 |
| Interquartile 75% (IQ3) | $73,333 | $75,038 |
| Interquartile Range (IQR) | $20,060 | $17,616 |
| Standard Deviation (Sample) | $18,554 | $19,596 |
| Standard Deviation (Population) | $18,146 | $19,468 |
Demographics Similar to Immigrants from Italy and Assyrians/Chaldeans/Syriacs by Householder Income Over 65 years
In terms of householder income over 65 years, the demographic groups most similar to Immigrants from Italy are Immigrants from South Eastern Asia ($64,089, a difference of 0.040%), Romanian ($64,142, a difference of 0.12%), Chilean ($63,957, a difference of 0.17%), British ($63,940, a difference of 0.20%), and Sri Lankan ($64,201, a difference of 0.21%). Similarly, the demographic groups most similar to Assyrians/Chaldeans/Syriacs are Immigrants from South Eastern Asia ($64,089, a difference of 0.030%), Romanian ($64,142, a difference of 0.050%), Sri Lankan ($64,201, a difference of 0.14%), Chilean ($63,957, a difference of 0.24%), and Immigrants from Hungary ($64,277, a difference of 0.26%).
| Demographics | Rating | Rank | Householder Income Over 65 years |
| Immigrants | Kuwait | 97.4 /100 | #90 | Exceptional $64,433 |
| Immigrants | Oceania | 97.4 /100 | #91 | Exceptional $64,416 |
| Immigrants | Bulgaria | 97.3 /100 | #92 | Exceptional $64,379 |
| Jordanians | 97.1 /100 | #93 | Exceptional $64,313 |
| Immigrants | Egypt | 97.0 /100 | #94 | Exceptional $64,299 |
| Immigrants | Latvia | 97.0 /100 | #95 | Exceptional $64,298 |
| Immigrants | Hungary | 97.0 /100 | #96 | Exceptional $64,277 |
| Sri Lankans | 96.7 /100 | #97 | Exceptional $64,201 |
| Romanians | 96.5 /100 | #98 | Exceptional $64,142 |
| Assyrians/Chaldeans/Syriacs | 96.4 /100 | #99 | Exceptional $64,108 |
| Immigrants | South Eastern Asia | 96.3 /100 | #100 | Exceptional $64,089 |
| Immigrants | Italy | 96.2 /100 | #101 | Exceptional $64,065 |
| Chileans | 95.8 /100 | #102 | Exceptional $63,957 |
| British | 95.7 /100 | #103 | Exceptional $63,940 |
| Immigrants | Cameroon | 95.6 /100 | #104 | Exceptional $63,907 |
| Italians | 95.5 /100 | #105 | Exceptional $63,885 |
| Immigrants | Argentina | 95.5 /100 | #106 | Exceptional $63,885 |
| Pakistanis | 95.3 /100 | #107 | Exceptional $63,844 |
| Palestinians | 95.1 /100 | #108 | Exceptional $63,800 |
| Europeans | 95.0 /100 | #109 | Exceptional $63,779 |
| Immigrants | Zimbabwe | 94.3 /100 | #110 | Exceptional $63,643 |